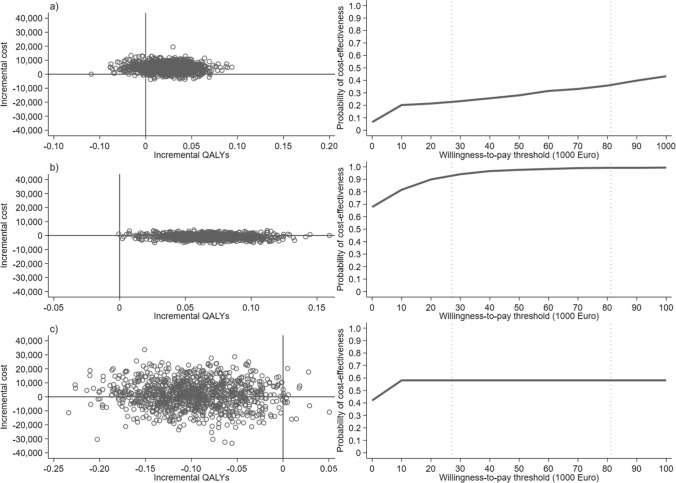
Fig. 2.
Cost-effectiveness plane with 1000 pairwise bootstrapped incremental cost-effectiveness ratios [ICERs] (left side) and the cost-effectiveness acceptability curve showing the probability of cost effectiveness at different willingness-to-pay thresholds for the intervention (right side) for the a full population (percentage of ICERs in the north-east quadrant [NE]: 80.80%, percentage of ICERs in the south-east quadrant [SE]: 6.20%, percentage of ICERs in the north-west quadrant [NW]: 12.70%, percentage of ICERs in the south-west quadrant [SW]: 0.03%), b non-long stayers (NE: 32.20%, SE: 67.80%, NW: 0.01%, SW: 0.00%), and c long stayers (NE: 0.07%, SE: 0.08%, NW: 57.30%, SW: 41.20%), respectively. The dotted lines represent minimum and maximum willingness to pay for the Norwegian setting (€27,067–81,200). QALY quality-adjusted life year

