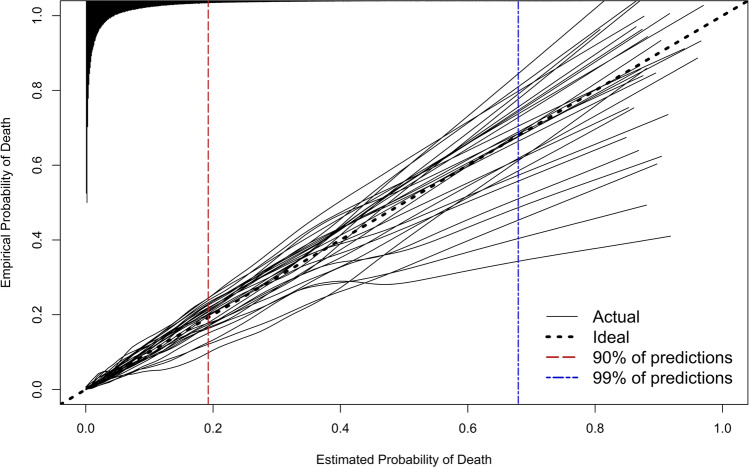
Figure 4.
Calibration on internal-external cross-validation for each held-out hospital. The histogram on the top denotes the distribution of predicted probabilities and is not scaled to the y-axis. Ninety percent of predicted probabilities are to the left of the red vertical dashed line, and 99% of predicted probabilities are to the left of the blue vertical dashed line. Performance metrics superimposed on each held-out hospital’s calibration curve are available in Figure A1.

