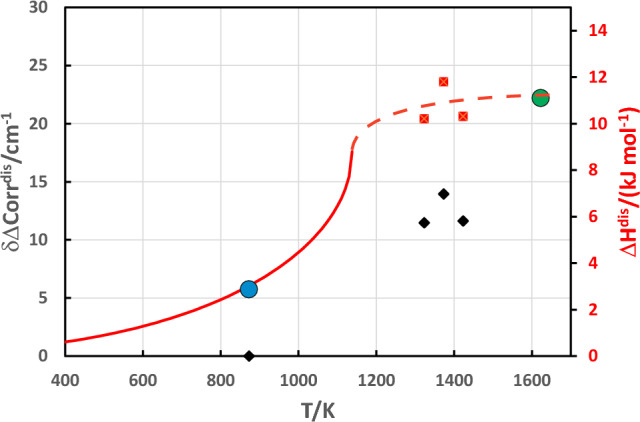
Fig. 2.

IR line broadening (δΔcorrdis) due to disordering (black diamonds) from the low wavenumber region and enthalpy (ΔHdis) of disordering (red squares) plotted against temperature. The solid line represents the tricritical Landau description of Carpenter et al. (1990a). The broken line is a visual guide for short-range behaviour. The blue circle is ΔHdis of the naturally ordered sample calculated by the DFT method. The green circle at 1623 K is ΔHdis measured by Wood et al. (1980) plus ΔHdis of the naturally ordered omphacite sample
