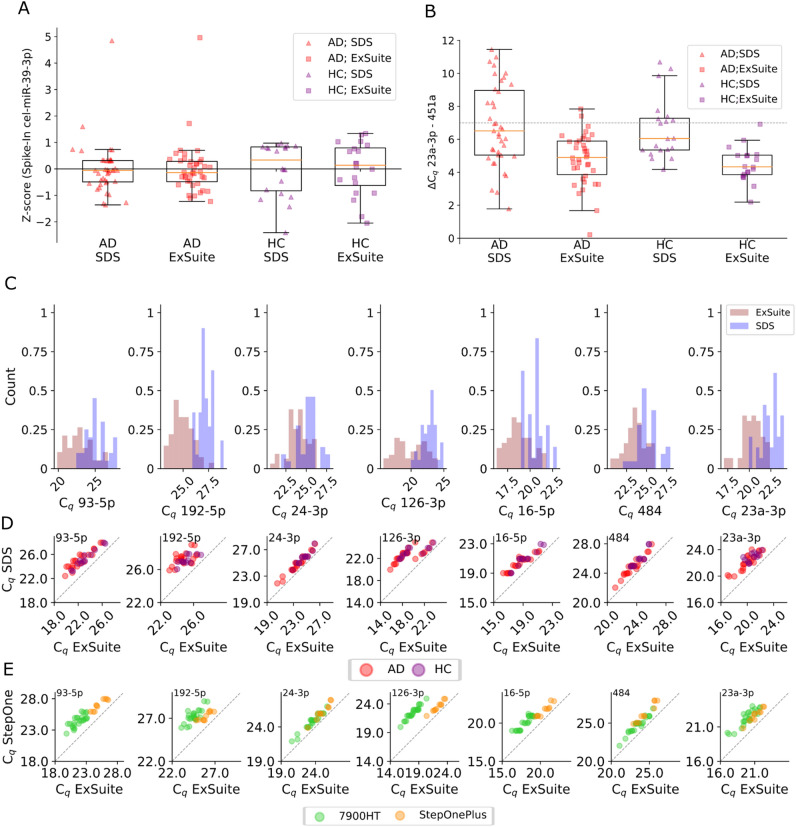
Figure 1.
Białystok cohort data analysed using different machines and software. (A) Z-score of cel-miR-39-3p spike-in in the group diagnosed with AD and in control group obtained using SDS or ExSuite software. (B) Standard evaluation of haemolysis level in the samples based on ΔCq between miR-23a-3p (plasma marker) and miR-451a (red blood cell marker) with the dashed line showing a commonly applied threshold of 7, used as a cutoff for haemolysis. (C) Comparison of distribution of Cq values of potential normalisers for data analysed with ExpressionSuite (ExSuite) or Sequence Detection System (SDS) Software. (D) Pairwise Cq plots for each potential normaliser, coloured by diagnostic group: red = Alzheimer’s disease (AD), purple = Cognitively normal (HC). (E) Data from D, coloured according to the PCR machine used for analysis: green = 7900HT, orange = StepOnePlus.

