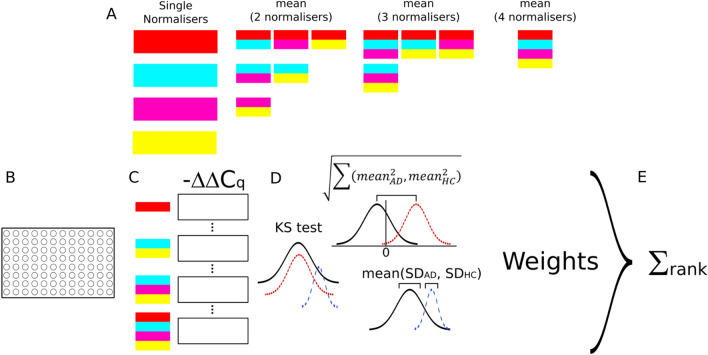
Figure 3.
Scheme for the identification of optimal normalisers. (A) Representation of the combinatorial approach to evaluating normaliser combinations. For n normalisers, there are 2n − 1 combinations. (B) Plasma samples analyzed by RT-qPCR and ExpressionSuite. (C) Cq values used to calculate − ΔΔCq for each combination of normalisers (abbreviated here). (D) Normalised values of each combination of n normalisers for Alzheimer’s disease (AD) and control (HC) groups compared along three metrics—Kolmogorov–Smirnov (KS) test, mean of absolute deviation of group means from zero, and mean of group standard deviations. Data are then ranked by minimising each metric, with the top-ranked normaliser combination given ncombinations points (15 in the example above), and the bottom given 0. Where desired, weights can be applied to each scoring component by multiplying the rank score by a specified value. (E) Individual rank scores for the metrics are summed, and then all normaliser combinations are ranked according to that sum.

