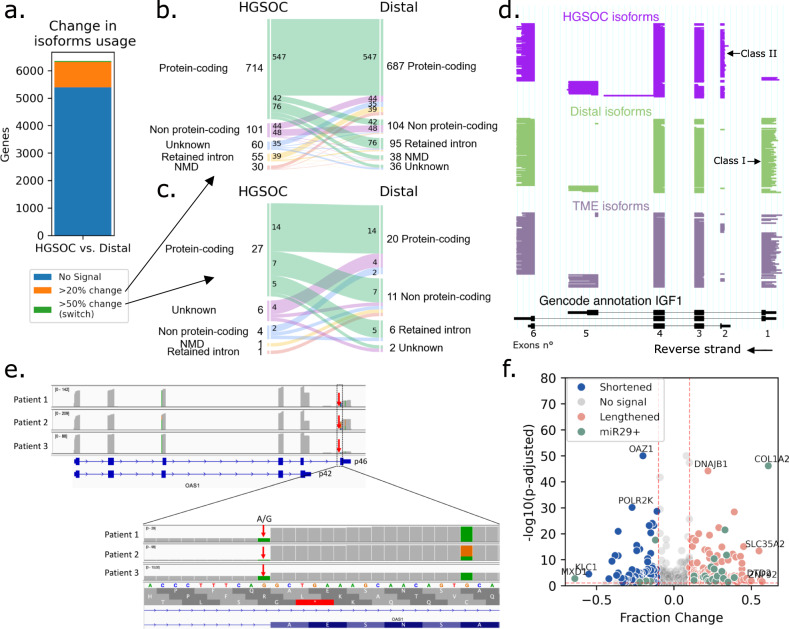
Fig. 4. Differential isoforms and 3’UTR lengths in cancer.
a Number of genes with change in isoform usage between HGSOC and all distal cells. In orange, genes with differentially expressed isoforms and a change in relative isoform abundance >20% (>50% in green). In blue, genes with no differentially expressed isoforms or change in relative isoform abundance <20%. b Alluvial plot of biotypes of most expressed isoforms in HGSOC and distal cells in genes containing an isoform change >20% (n = 960). Each vein represents the conversion of one biotype to another. For example, in seven genes, the most expressed isoform in HGSOC cells is protein-coding, while distal cells’ one is non-protein-coding. c Alluvial plot of biotypes of most expressed isoforms in HGSOC and distal cells in genes containing an isoform switch (>50% change, n = 39). d ScisorWiz representation of isoforms in IGF1, each horizontal line represents a single isoform colored according to cell types. Exons are numbered according to the Gencode reference, Class I and II isoforms are isoforms with starting exons 1 and 2, respectively. e Top: IGV view of OAS1 expression in patients. Patient 3 has low p46 expression compared to others. Bottom: zoom on the last exon of isoform p46, where all patients have at least one mutated A allele in the splice acceptor site. f Volcano plot of genes with APA in cancer versus distal cells. Genes have either a lengthened (red) or shortened (blue) 3’UTR in cancer cells compared to all distal cells. Differentially lengthened or shortened genes targeted by miR-29 are colored in green. Genes with -log10(P-adjusted) >10 and |fraction change| >0.5 are annotated. APA statistical test is described in “Methods”.

