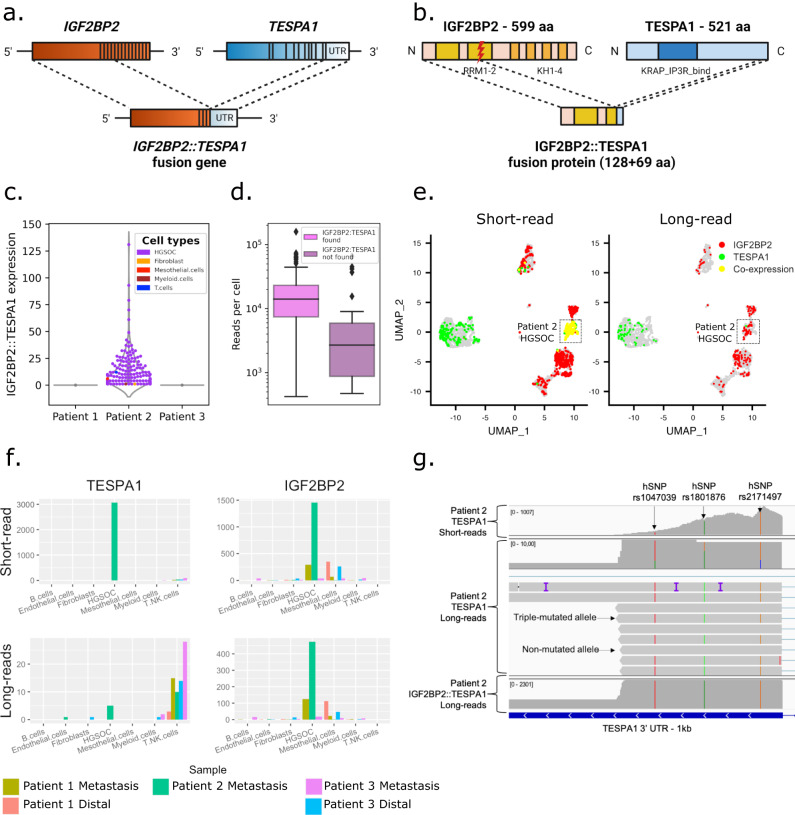
Fig. 5. Tumor and patient-specific detection of a IGF2BP2::TESPA1 gene fusion.
a Overview of wt IGF2BP2, wt TESPA1, and IGF2BP2::TESPA1 gene fusion with exon structure. b Overview of wt IGF2BP2, wt TESPA1, and fusion protein with protein domains. RRM RNA-recognition motif, KH heterogeneous nuclear ribonucleoprotein K-homology domain, KRAP_IP3R_bind Ki-ras-induced actin-interacting protein-IP3R- interacting domain. c Violin plot showing patient- and tumor-specific IGF2BP2::TESPA1 fusion transcript detection in Patient 2. d UMI count in fusion-containing (n = 173) versus -lacking (n = 32) Patient 2 tumor cells. Boxes display the first to third quartile with median as horizontal line, whiskers encompass 1.5 times the interquartile range, and data beyond that threshold is indicated as outliers. e UMAP embeddings of the cohorts’ short-read data. Cells are colored if they express IGF2BP2 (red), TESPA1 (green), or both (yellow) in short- (left panel) or long reads (right panel). f Raw expression of TESPA1 (left) and IGF2BP2 (right) in short- (top) or long reads (bottom), by sample and cell type. g IGV view of short reads (top), non-fusion long reads (middle), and fusion long reads (bottom) mapping to the 3’UTR of TESPA1. Non-fusion reads are either triple hSNP-mutated or non-mutated, while fusion and short reads are only triple hSNP-mutated.

