
Figure 2: Pro-inflammatory necroptosis is activated in the brain of Epm2b−/− mice.
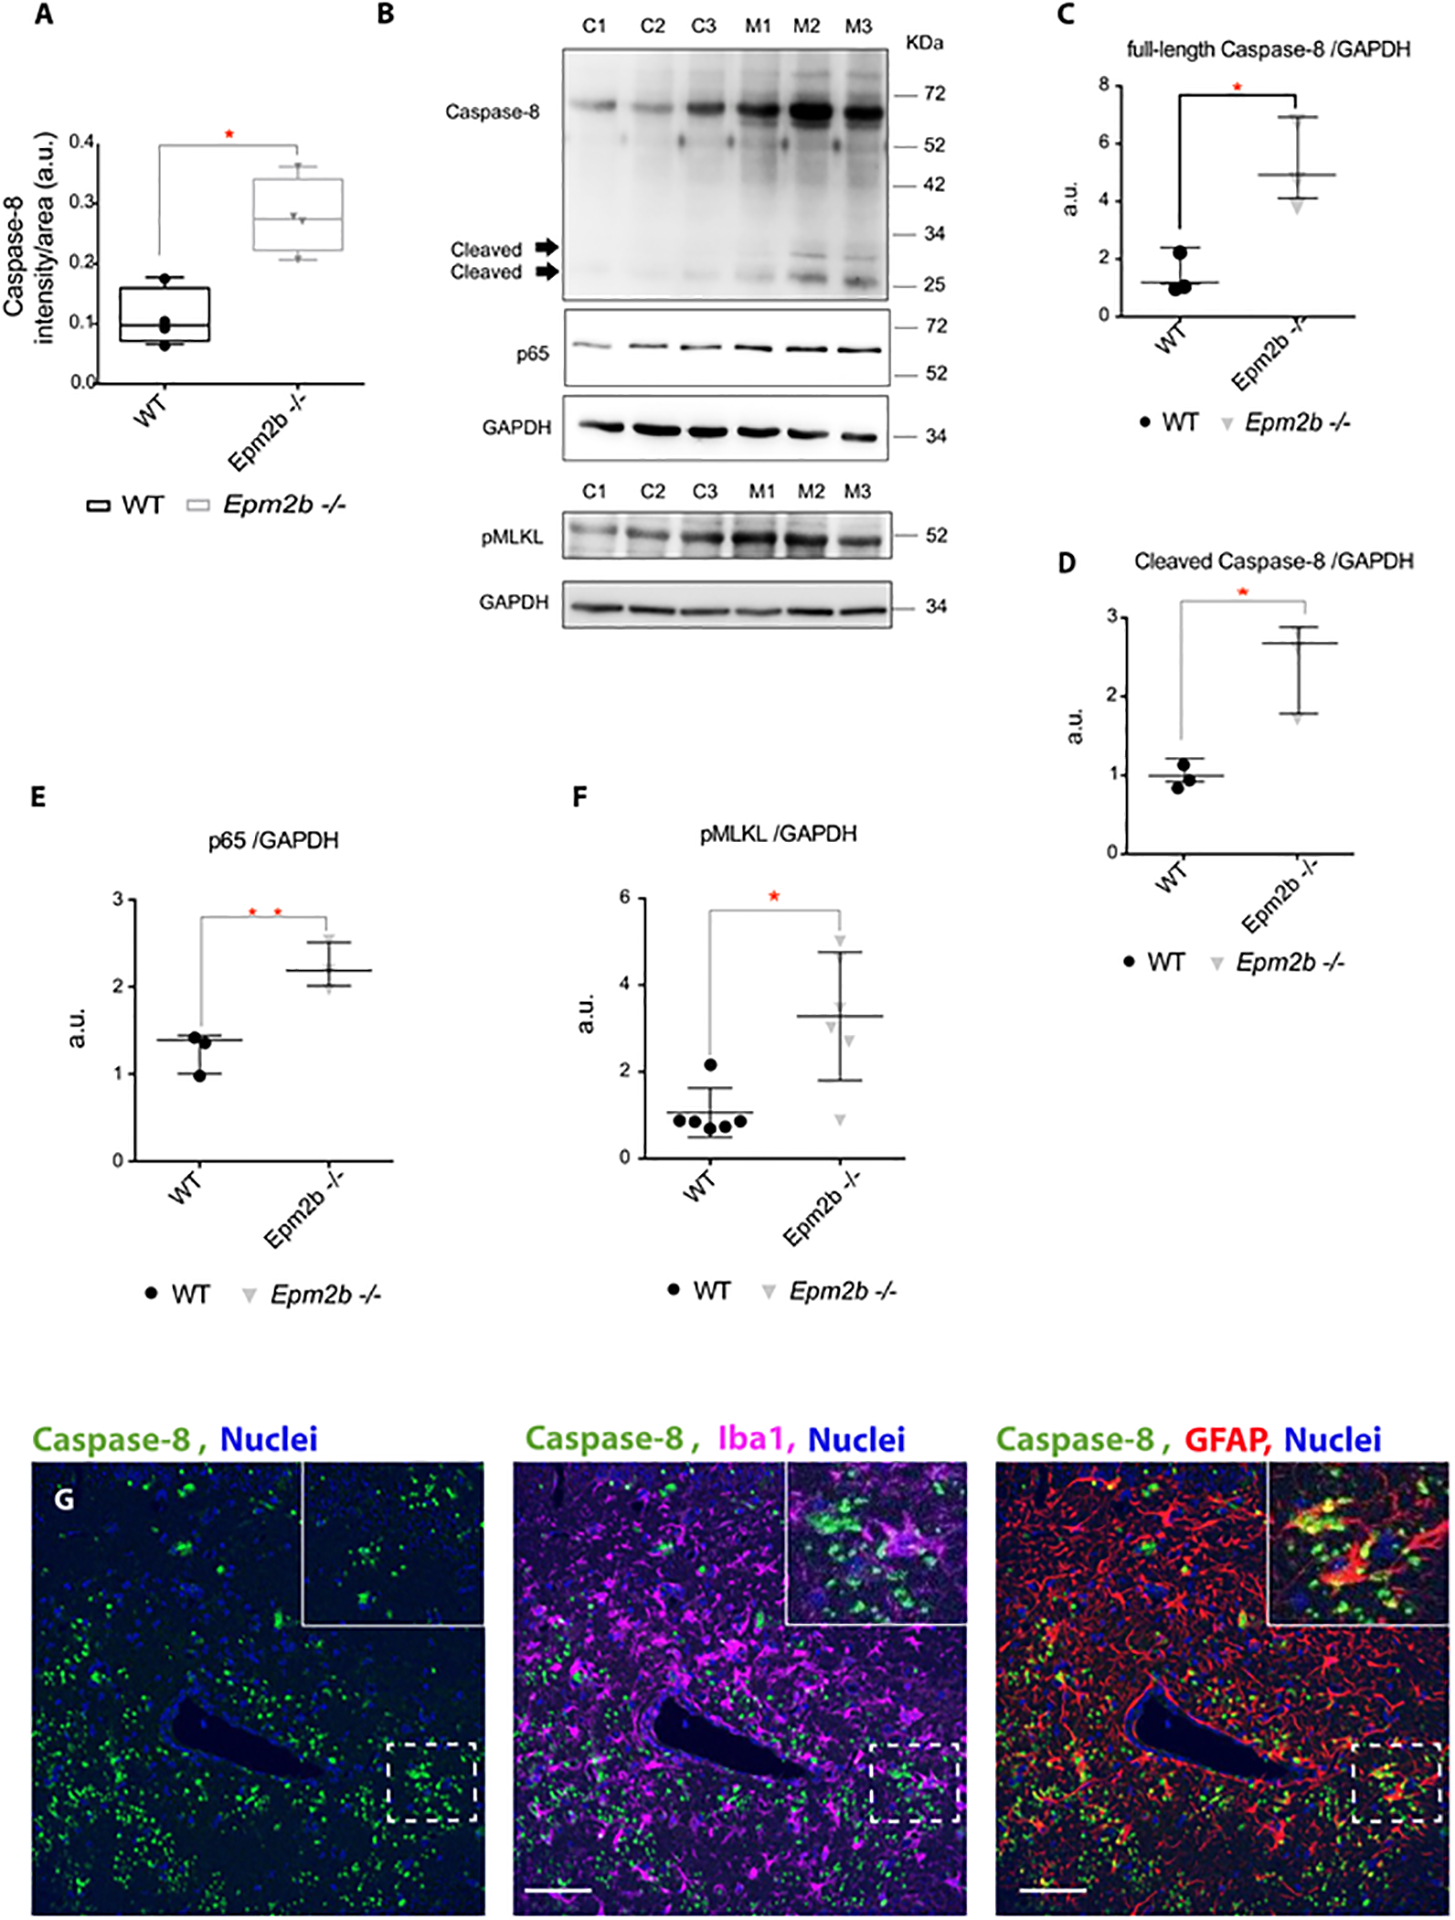
(A) Quantification of the intensity signal obtained by immunofluorescence with anti-Caspase-8 in the RLM+MoDG area of Epm2b−/− and wt 16 months old mice. (B) Protein levels of Caspase-8 (full length and cleaved), p65, and phospho (Ser345)-MLKL (pMLKL) were assessed by western blot of hippocampi extracts from 16-month-old wt (C1-C3) and Epm2b−/− (M1-M3) mice using the indicated antibodies. Molecular weight standards are on the right. Densitometric quantification of the corresponding blots was carried out as described in Methods. Protein levels of full-length Caspase-8 (C), cleaved Caspase-8 (D), p65 (E), and pMLKL (F) were related to the levels of GAPDH and represented as arbitrary units (a.u.). Results are expressed as median with a range of three independent samples from each genotype (C-E) or six independent samples for F. Differences between the two groups (wt and Epm2b−/− mice) were analyzed by Mann-Whitney non-parametric t-test. P-values have been considered as *p<0.05 and **p<0.01. (G) Representative confocal images of the immunofluorescence analysis of the RLM+MoDG area from 16-month-old Epm2b−/− mice using anti-GFAP (red), anti-Iba1 (magenta), and anti-Caspase-8 (green) (see Supplementary Table S1). Nuclei (blue) were stained with DAPI. The scale bar, shown in the merged images (central and right panels), corresponds to 25μm. A squared dashed line indicates the area that is magnified.