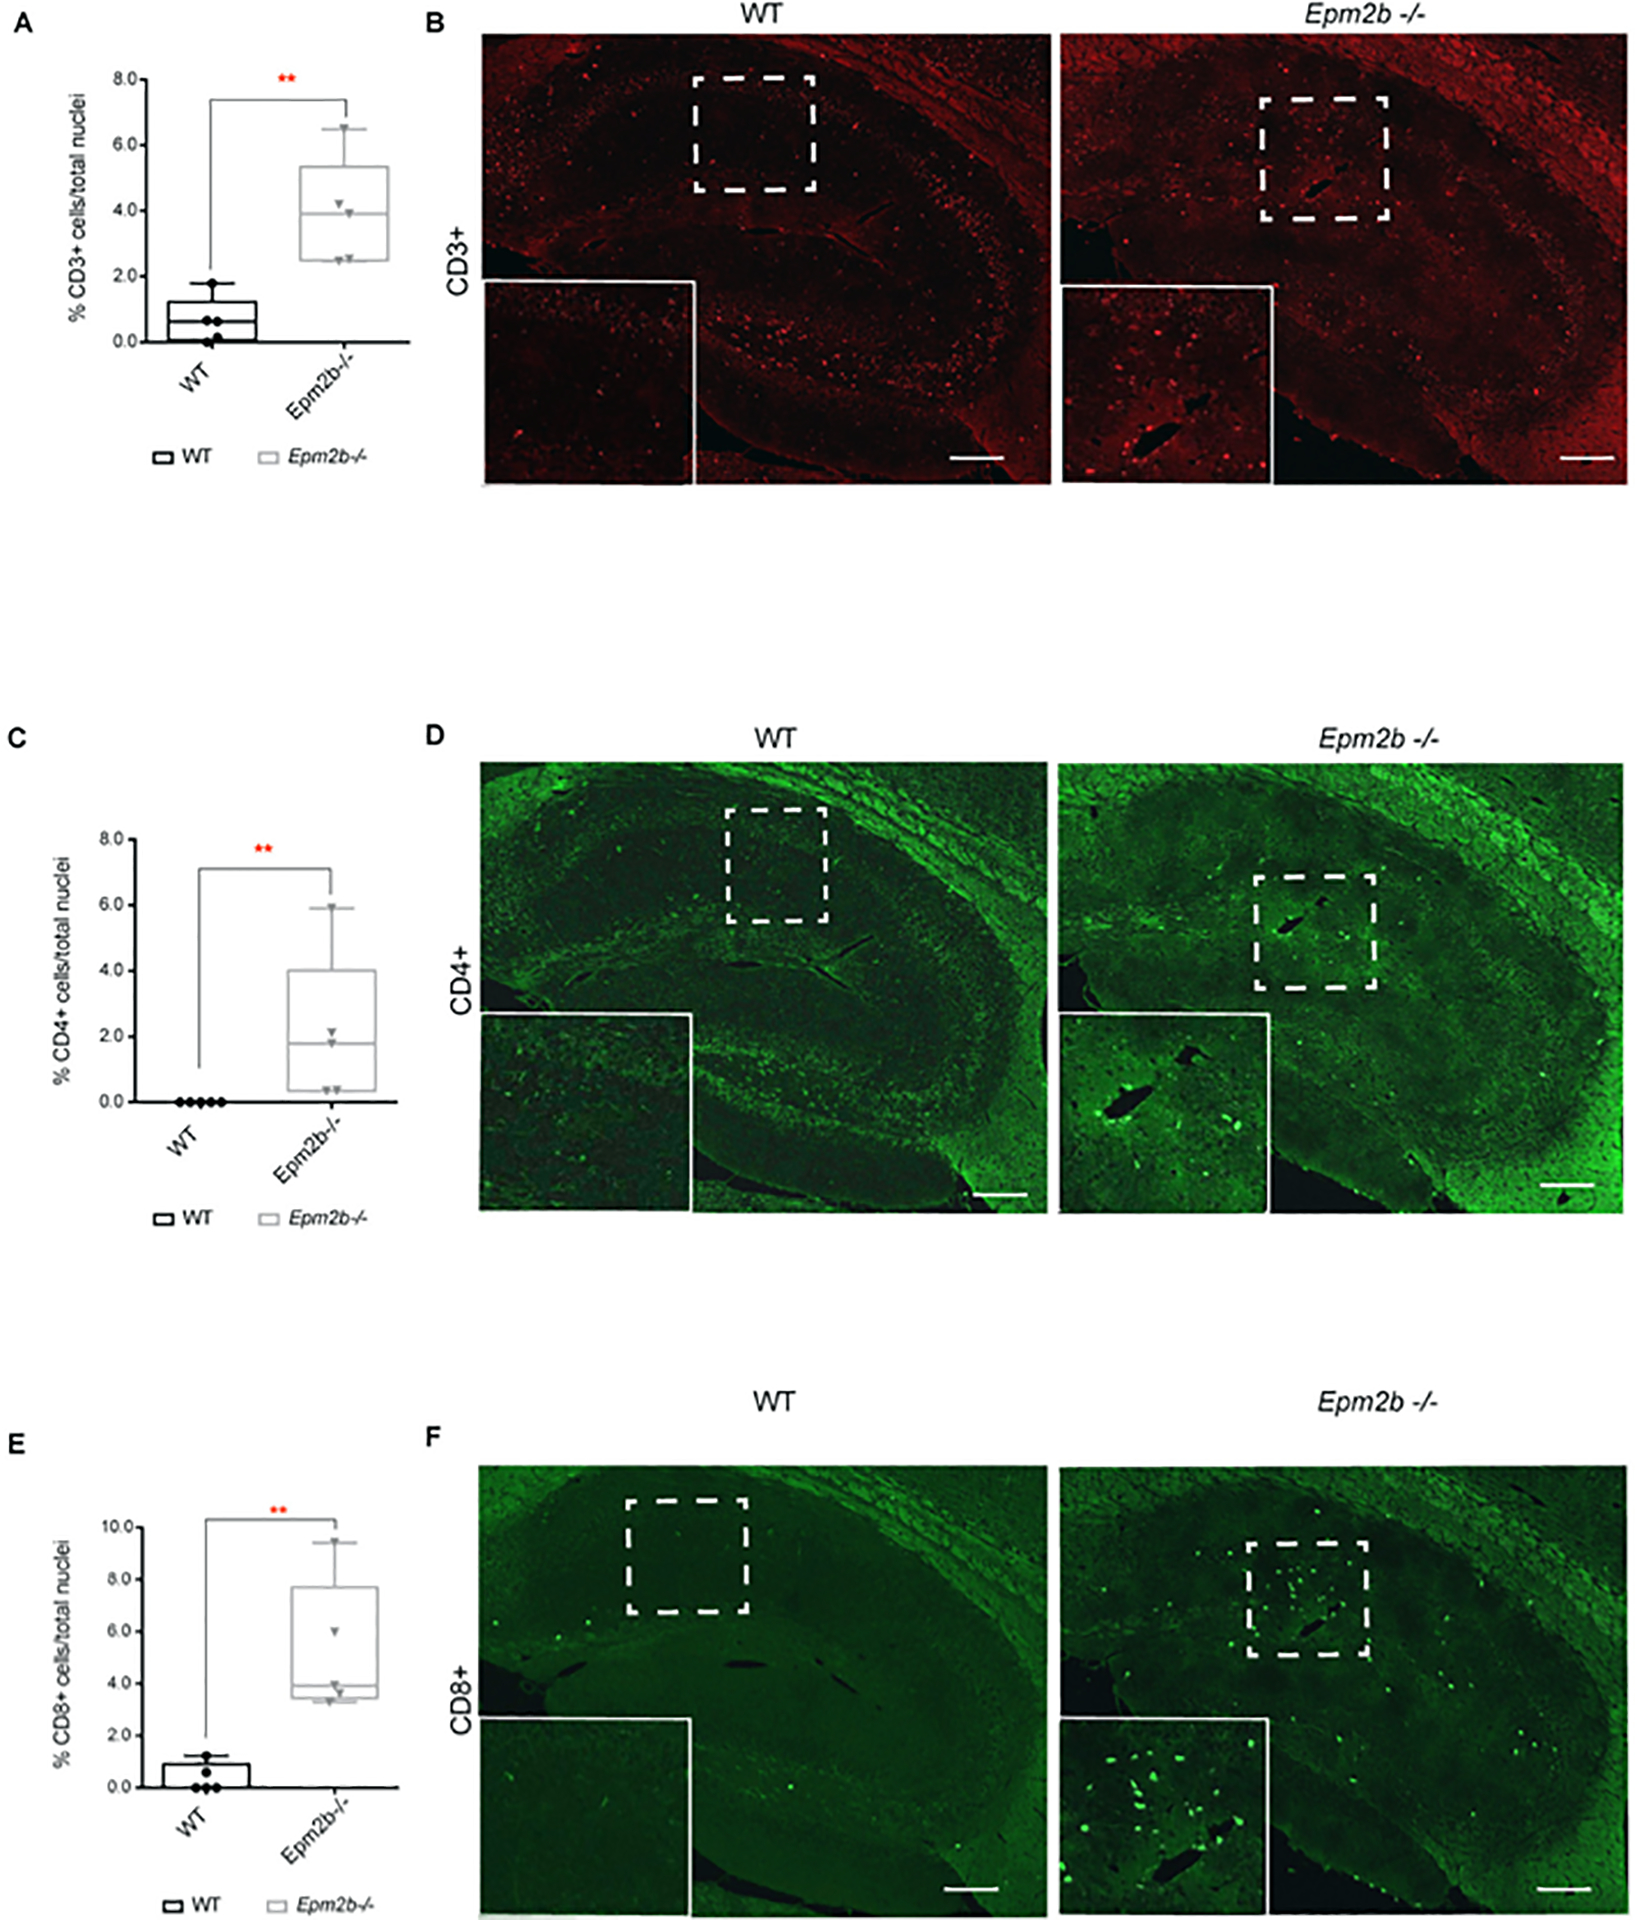
Figure 5: Hippocampus of 16 months-old Epm2b−/− mice present infiltration of T-lymphocytes.

(A, C, and E) Quantification of the relative number of infiltrating cells related to the total nuclei in the corresponding area. (A) CD3+ (T-cell marker) cells, (C) CD4+ (helper T-cell marker) cells, and (E) CD8+ (cytotoxic T-cell marker) cells in the whole hippocampus area of 16 months-old Epm2b−/− and wt mice detected by immunofluorescence. The results are represented as a median with a range of five samples for each genotype including male and female mice. Differences between the two groups (wt and Epm2b−/− mice) were analyzed by Mann-Whitney non-parametric t-test. P-values have been considered as **p<0.01. (B, D, and F) representative confocal images of the whole hippocampus from 16 months-old Epm2b−/− and wt mice stained with the following antibodies: Rat anti-CD3 (red) (B), mouse anti-CD4 (D) or rabbit anti-CD8 (green) (F). The scale bar corresponds to 100μm. A squared dashed line indicates the area that is magnified.
