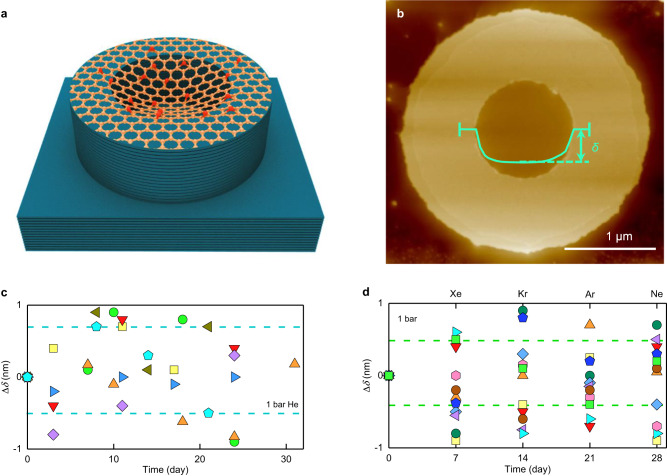
Fig. 1. Gas impermeability of GO monolayers.
a Schematic of microcontainer devices. b AFM image of a typical device. Green curve, profile along the membrane’s diameter. The vertical bars on the green curve mark the 150 nm region around the diameter over which such profiles were averaged. Note that δ was typically a few tens of nm so that, for clarity, the vertical scale for the green curve is exaggerated with respect to the well’s micrometer diameter. The sagging inside is due to van der Waals interaction with the sidewalls2, 31. c Changes in δ for GO-sealed microcontainers placed under 1 bar of He for a month (different symbols correspond to 11 different devices). d Similar measurements for 8 GO-sealed microcontainers placed under 3 bar of Xe, Kr, Ar and Ne. The dashed lines in panels c and d show the full-range scatter for the devices coded with the same colors.

