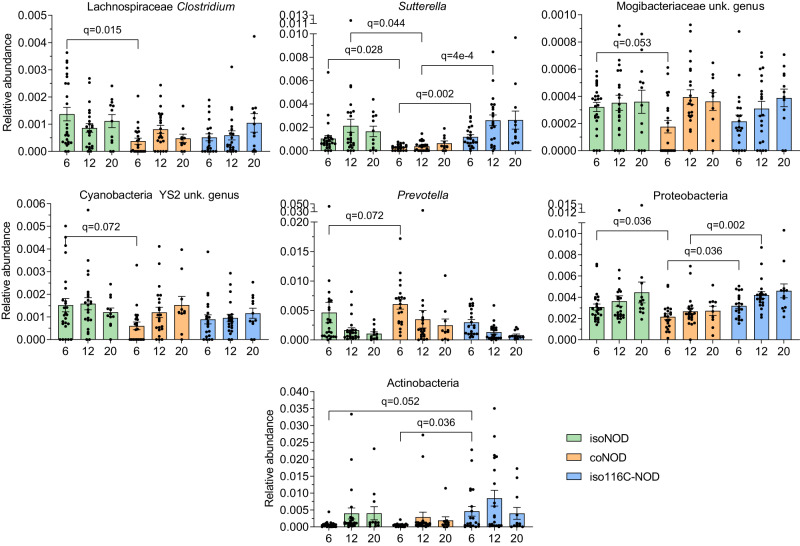
Fig. 7. Relative abundance of gut microbiota significant taxa from non-diabetic mice of the T1D-prone models.
16S rRNA gene sequencing was conducted in faecal samples at 6, 12, and 20 weeks of age from non-diabetic isolated NOD (isoNOD), cohoused NOD (coNOD), and isolated 116C-NOD (iso116C-NOD) mice. Sample sizes: isoNOD (6 weeks: n = 25, 12 weeks: n = 23, 20 weeks: n = 12); coNOD (6 weeks: n = 21, 12 weeks: n = 22, 20 weeks: n = 10); iso116C-NOD (6 weeks: n = 21, 12 weeks: n = 21, 20 weeks: n = 12). Data are expressed as mean ± SE. Relative abundance data were analysed using the MaAsLin2 statistical framework (mixed-effects linear regression model, two-sided test, adjustment for multiple comparisons), where p-values were corrected using the false discovery rate (FDR).

