
Fig. 5. Epitope edited hematopoietic system remains functional.
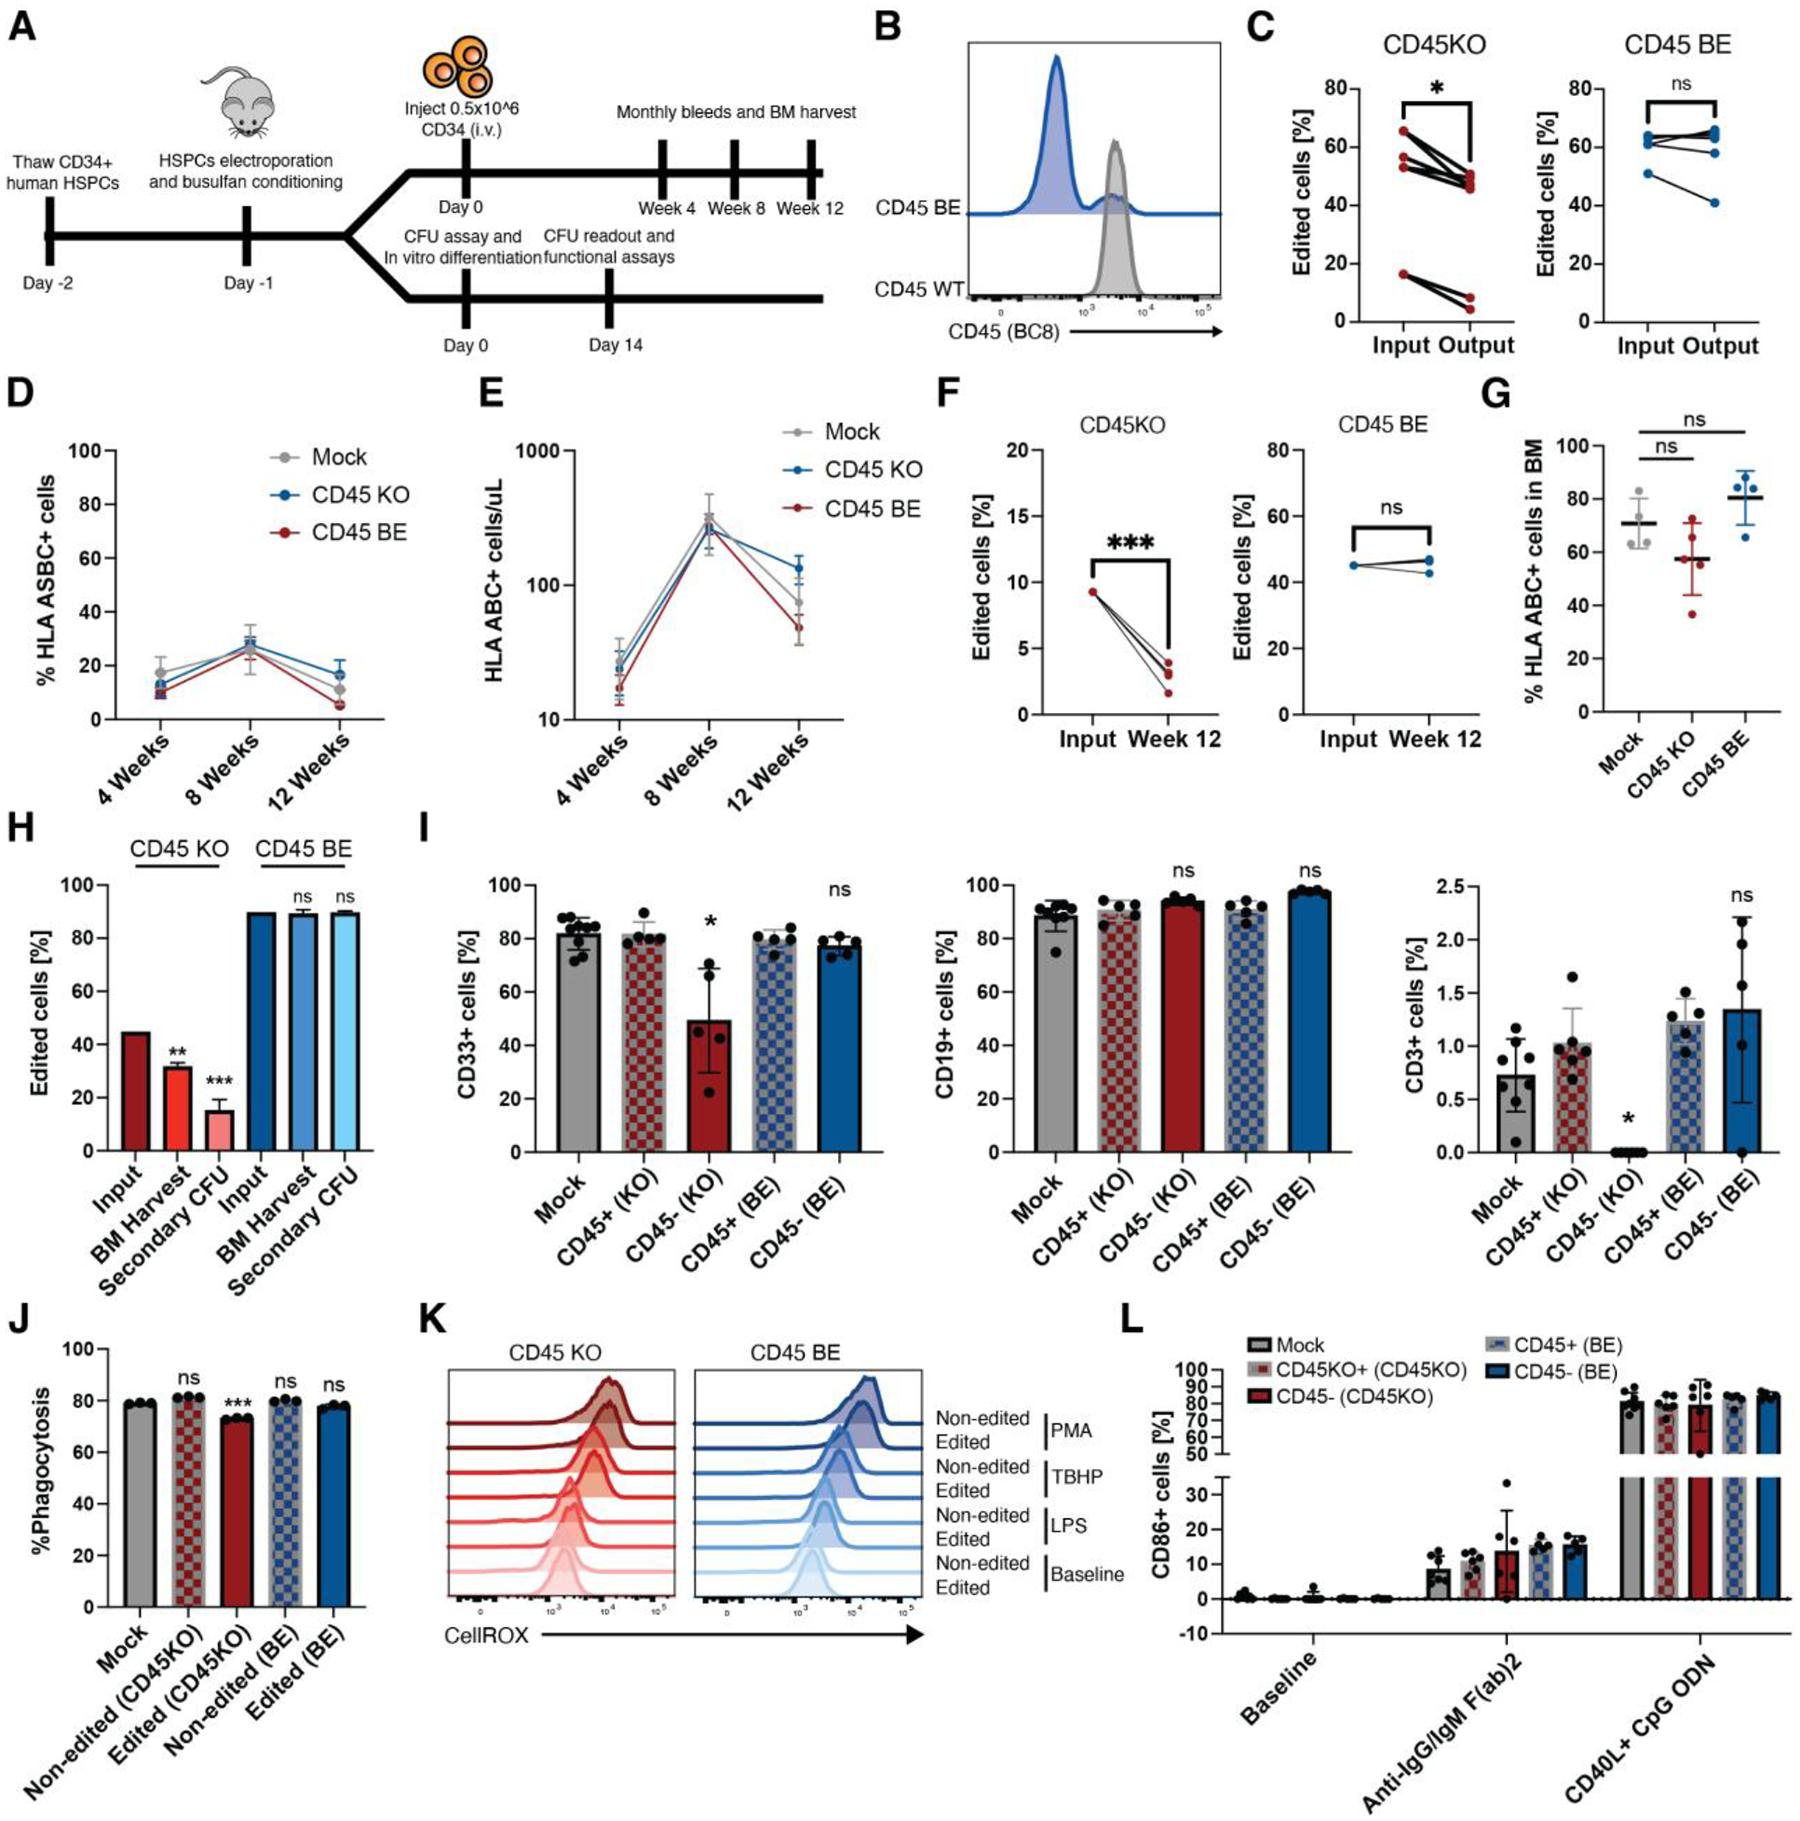
(A) Schematic overview. Human CD34+ HSCs were edited with gRNA and either ABE8e mRNA or Cas9 RNP’s. After recovery, CD34+ cells were injected into NSG mice to measure engraftment and differentiation in peripheral blood. A subset of edited CD34+ cells were plated in semi-solid methocult media for colony formation or differentiated into myeloid cells for functional assays. (B) Edited and control CD34+ HSCs were stained with BC8 antibody clone. (C) INDEL frequency in CD45KO colonies as quantified by TIDE(43) decreased after 14 days in methocult media whereas the frequency of base-edited alleles as measured by EditR remained stable (*p<0.05, paired t-test, n=6 or 7 from 4 independent donors). (D) Mice engrafted with CD45BE HSCs show similar frequency of human engrafted cells at early, mid, and late timepoints (ns=p>0.05; *p<0.05, two-way ANOVA, n=5–8). Data are represented as mean ± SD. (E) Mice engrafted with CD45BE HSCs show similar numbers of human engrafted cells at early, mid, and late timepoints (ns=p>0.05*p<0.05, two-way ANOVA, n=5–8). Data are represented as mean ± SD. (F) Longitudinal analysis of human engrafted cells shows a decrease in the frequency of CD45KO cells, while epitope edited cells show stable engraftment over 12 weeks (***p<0.001, paired t-test, n=5). (G) Mice engrafted with CD45BE HSCs show similar frequency of human engrafted in the bone marrow (ns=p>0.05, one way ANOVA, n=4–5). Data are represented as mean ± SD. (H) Mice engrafted with CD45KO HSCs show a decline in the frequency of edited cells in the BM and after secondary in vitro colony formation whereas the frequency of CD45BE edited cells remains unchanged compared to the injection input. (ns=p>0.05, **=p<0.01, ***=p<0.001, one way ANOVA compared to input, n=4–5). (I) Epitope edited HSCs show comparable myeloid, B cell, and T cell differentiation compared to unedited HSCs whereas CD45KO HSCs have a decreased frequency of myeloid cells and undetectable levels of T cells in the peripheral blood. Myeloid, B-cell, and T-cell differentiation was assessed at 4 weeks, 8 weeks, and 12 weeks respectively when peak differentiation into the corresponding lineage occurs in the NSG xenograft model. (ns=p>0.05; *=p<0.05, one way ANOVA, n=5–8). Data are represented as mean ± SD. (J) In vitro-differentiated CD45KO and CD45BE myeloid cells retain phagocytosis ability as measured by internalization of pHrodo deep red E. coli bioparticles. (ns=p>0.05; ***p<0.01, one way ANOVA, n=3 technical replicates). Data are represented as mean ± SD. (K) Levels of reactive oxygen species (ROS) production after lipopolysaccharide (LPS), tert-butyl hydroperoxide (TBHP), or phorbol myristate acetate (PMA) stimulation are similar among unedited and CD45 edited cells. ROS production was measured by fluorescence of CellROX deep red reagent. (L) In vivo differentiated B cells were harvested from peripheral blood of mice 10 weeks post-transplant and activated by either CD40L+CpG ODN or anti-IgG/IgM (Fab)2 for 48hrs. Activation as measured by surface level expression of CD86 did not differ between edited and unedited B cells and was significantly above baseline (n=5–8 mice per group). Data are represented as mean ± SD.