. 2019 Dec 18;133(5):jcs237610. doi: 10.1242/jcs.237610

Fig. 1.

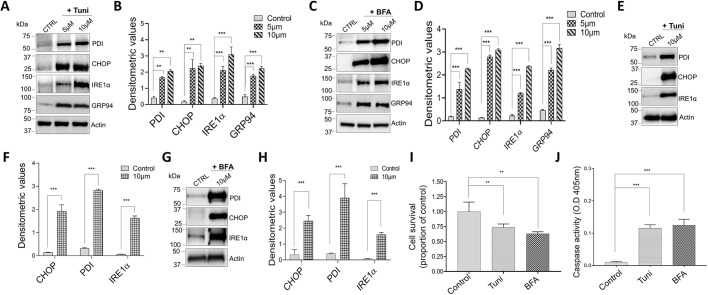
Fig. 1. Tunicamycin and brefeldin A treatment induces ER stress-causing cell death in macrophages. (A,C) Representative immunoblot images showing the expression of ER stress markers PDI, CHOP, IREα and GRP94, and of actin, in Raw 264.7 macrophages pretreated with 5 μM or 10 μM tunicamycin (Tuni) (A), or BFA (C) for 12 h. (B,D) Quantification of densitometric values (mean±s.d.) from bands as shown in A and C. (E,G) Representative immunoblot images showing the expression of ER stress markers in bone marrow-derived macrophages (BMDMs) pretreated with 10 μM Tuni (E) or BFA (G) for 12 h. (F,H) Quantification of densitometric values (mean±s.d.) from bands as shown in E and G. (I,J) Quantification (mean±s.d.) of cell survival (I) and caspase activity (J) of Raw 264.7 cells pretreated with 10 μM BFA or Tuni for 12 h. **P<0.01, ***P<0.001 by one-way ANOVA test. The data shown are representative of three independent experiments.

Tunicamycinand brefeldin A treatment induces ER stress-causing cell death in macrophages. (A,C) Representative immunoblot images showing the expression of ER stress markers PDI, CHOP, IREα and GRP94, and of actin, in Raw 264.7 macrophages pretreated with 5 μM or 10 μM tunicamycin (Tuni) (A), or BFA (C) for 12 h. (B,D) Quantification of densitometric values (mean±s.d.) from bands as shown in A and C. (E,G) Representative immunoblot images showing the expression of ER stress markers in bone marrow-derived macrophages (BMDMs) pretreated with 10 μM Tuni (E) or BFA (G) for 12 h. (F,H) Quantification of densitometric values (mean±s.d.) from bands as shown in E and G. (I,J) Quantification (mean±s.d.) of cell survival (I) and caspase activity (J) of Raw 264.7 cells pretreated with 10 μM BFA or Tuni for 12 h. **P<0.01, ***P<0.001 by one-way ANOVA test. The data shown are representative of three independent experiments.