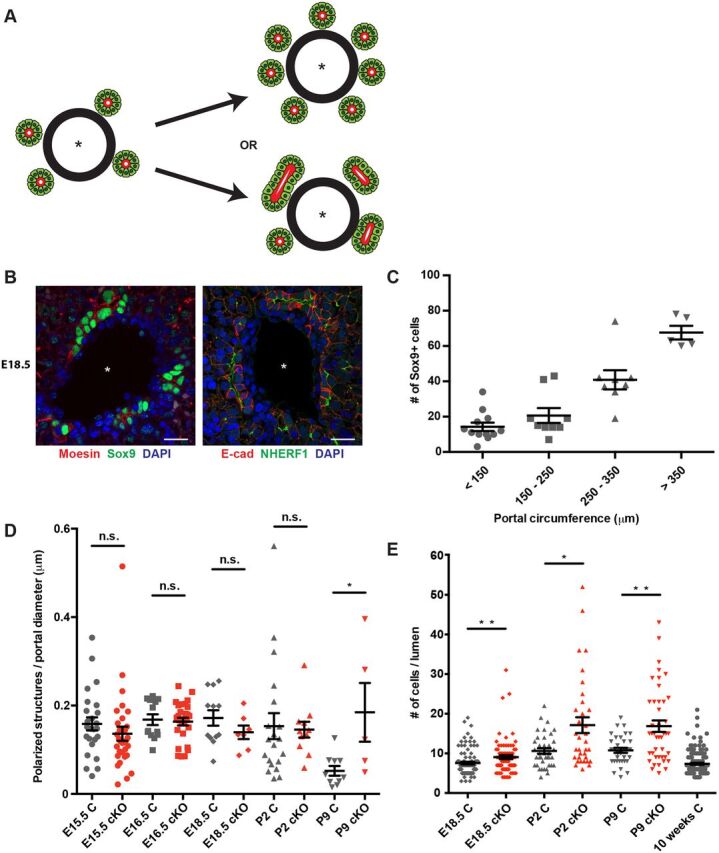
Fig. 2.

Ectopic Sox9+ cells are recruited to each polarizing biliary structure in the absence of NF2. (A) Excess periportal Sox9+ cells in the Nf2cKO liver could reflect an increase in the number of polarized structures that are initiated (top) or an increase in the number of Sox9+ cells that are recruited to each structure (bottom). Asterisk, portal vein. (B) Confocal images showing the localization of moesin (left) and NHERF1 (right) to the luminal surface of immature biliary structures in control E18.5 livers, allowing the identification of individual polarized structures. Scale bars: 20 µm. (C) Quantitation of the number of periportal Sox9+ cells as a function of portal circumference in the E18.5 control liver. n=10 control embryos evaluated. (D) Comparison of the number of individual polarized structures in the developing control (gray) and Nf2cKO (red) liver normalized to portal diameter. Each data point represents an individual portal space. Sample size (control, Nf2cKO embryos): E15.5 (5, 9), E16.5 (3, 4), E18.5 (4, 3), P2 (6, 4), P9 (4, 2). (E) Quantitation of the number of Sox9+ cells per polarized structure in control (gray) and Nf2cKO (red) livers. Note that the number of Sox9+ cells per polarized structure in Nf2cKO is an underestimate because many are shared between two polarized structures and were only counted once. Each data point represents one polarized structure. Sample size (control, Nf2cKO embryos): E18.5 (4, 3), P2 (6, 4), P9 (4, 2), 10 weeks (3). (D,E) n.s., not statistically significant; *P<0.05, **P<0.01 (Mann–Whitney test). Values are mean±s.e.m.
