. 2018 Apr 30;145(9):dev162123. doi: 10.1242/dev.162123

Fig. 4.

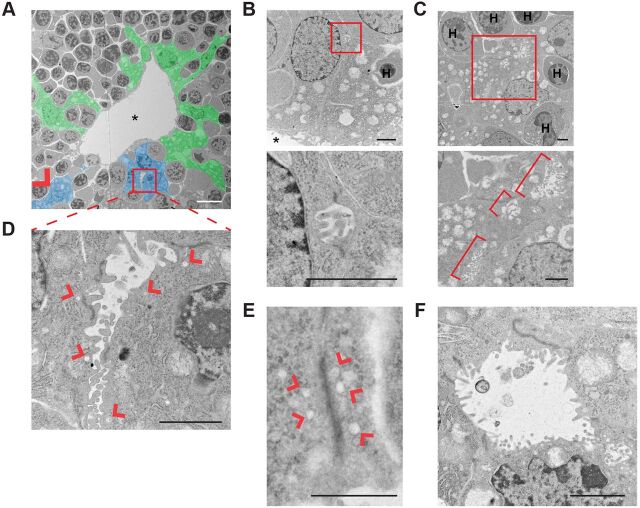
Fig. 4. Ultrastructural analysis of de novo lumen formation during biliary morphogenesis in control livers. (A) Transmission electron micrograph of a portal space in a control E15.5 liver pseudo-colored to show ductal plate cells (blue) that form microlumens flanked by electron-dense junctions (red box and arrowhead) along shared boundaries with parenchymal hepatoblasts (also blue) in this plane of section. Other ductal plate cells that do not form de novo lumens in this plane of section are shown in green; many envelop hematopoietic cells (gray surrounded by green). Portal vein is marked by an asterisk. (B-F) High-magnification of examples of developing luminal structures generated by ductal plate cells in control E15.5-E16.5 livers. Boxed areas (B,C) are magnified beneath. (B) Microlumen (∼1 µm) filled with microvilli and flanked by electron-dense cell junctions formed at the ab-endothelial boundary between two ductal plate cells. (C) Tandem microlumens along boundaries between two ductal plate cells and one parenchymal hepatoblast (brackets). (D) Expanding lumen (2-6 µm) filled with microvilli and flanked by electron-dense cell junctions and associated vesicular structures (arrowheads). (E) Elongated electron-dense cell junction without microlumens but clearly associated with vesicular structures (arrowheads). (F) Open lumen with fewer microvilli surrounded by wedge-shaped cells that are connected by electron-dense apical junctions. H, hematopoietic cell. Scale bars: 10 µm in A; 2 µm in B-D,F; 1 µm in E.

Ultrastructural analysis of de novo lumen formation during biliary morphogenesis in control livers. (A) Transmission electron micrograph of a portal space in a control E15.5 liver pseudo-colored to show ductal plate cells (blue) that form microlumens flanked by electron-dense junctions (red box and arrowhead) along shared boundaries with parenchymal hepatoblasts (also blue) in this plane of section. Other ductal plate cells that do not form de novo lumens in this plane of section are shown in green; many envelop hematopoietic cells (gray surrounded by green). Portal vein is marked by an asterisk. (B-F) High-magnification of examples of developing luminal structures generated by ductal plate cells in control E15.5-E16.5 livers. Boxed areas (B,C) are magnified beneath. (B) Microlumen (∼1 µm) filled with microvilli and flanked by electron-dense cell junctions formed at the ab-endothelial boundary between two ductal plate cells. (C) Tandem microlumens along boundaries between two ductal plate cells and one parenchymal hepatoblast (brackets). (D) Expanding lumen (2-6 µm) filled with microvilli and flanked by electron-dense cell junctions and associated vesicular structures (arrowheads). (E) Elongated electron-dense cell junction without microlumens but clearly associated with vesicular structures (arrowheads). (F) Open lumen with fewer microvilli surrounded by wedge-shaped cells that are connected by electron-dense apical junctions. H, hematopoietic cell. Scale bars: 10 µm in A; 2 µm in B-D,F; 1 µm in E.