. 2018 Apr 30;145(9):dev162123. doi: 10.1242/dev.162123

Fig. 6.

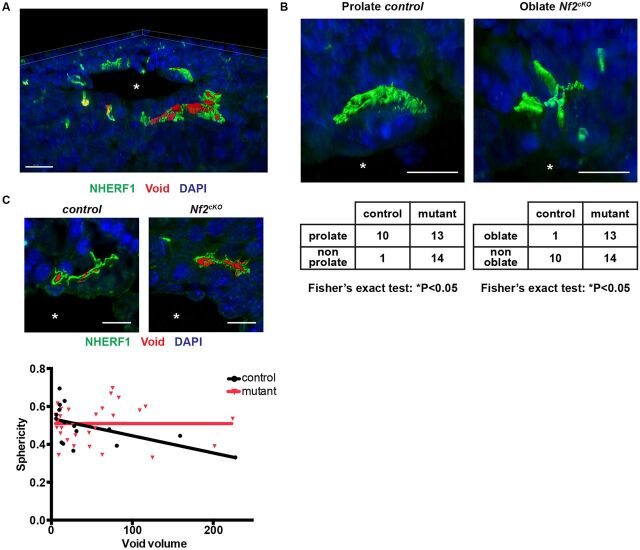
Fig. 6. 3D aspects of developing IHBDs. (A) Representative rendering showing complex 3D architecture of developing control E16.5 livers (from Movie 1). (B) Representative developing prolate (control) and oblate (Nf2cKO) lumens labeled with NHERF1 (green), along with their frequencies in E16.5 livers (bottom). Fisher's exact test was used to compare the ratios of prolate:non-prolate or oblate:non-oblate in control versus mutant. (C) Representative luminal cavities (voids, red; top) and graph of sphericity as a function of void volume in control and Nf2cKO E16.5 livers (bottom). Linear regression reveals that sphericity declines as a function of volume in control (*P<0.05) but not in Nf2cKO (n.s.). Each data point represents one luminal void volume. Sample size (control, Nf2cKO): E16.5 (4, 3). Asterisks, portal vein. Values shown are mean±s.e.m. Scale bars: 20 µm in A; 10 µm in B,C.

3D aspects of developing IHBDs. (A) Representative rendering showing complex 3D architecture of developing control E16.5 livers (from Movie 1). (B) Representative developing prolate (control) and oblate (Nf2cKO) lumens labeled with NHERF1 (green), along with their frequencies in E16.5 livers (bottom). Fisher's exact test was used to compare the ratios of prolate:non-prolate or oblate:non-oblate in control versus mutant. (C) Representative luminal cavities (voids, red; top) and graph of sphericity as a function of void volume in control and Nf2cKO E16.5 livers (bottom). Linear regression reveals that sphericity declines as a function of volume in control (*P<0.05) but not in Nf2cKO (n.s.). Each data point represents one luminal void volume. Sample size (control, Nf2cKO): E16.5 (4, 3). Asterisks, portal vein. Values shown are mean±s.e.m. Scale bars: 20 µm in A; 10 µm in B,C.