. 2018 Oct 8;145(19):dev168468. doi: 10.1242/dev.168468

Fig. 5.

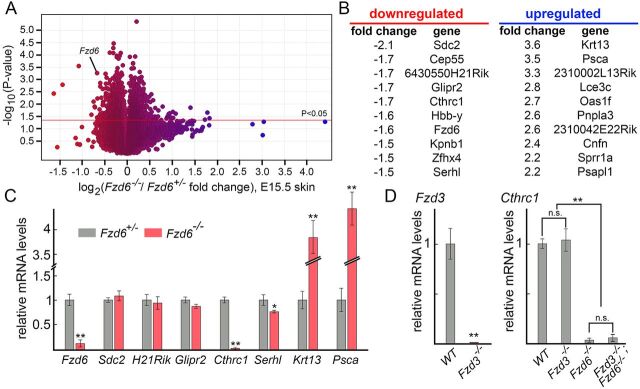
Fig. 5. Identification of Cthrc1 as a potential downstream effector of Fzd6. (A) Transcriptome changes in response to the loss of Fzd6. Mouse MOE430 2.0 Affymetrix arrays were hybridized in three biologically independent experiments with RNA from E15.5 Fzd6+/– and Fzd6–/– back skins. As expected, the probe set representing Fzd6 transcripts shows reduced hybridization with RNA from Fzd6–/– skins. Blue, upregulated; red, downregulated expression. (B) Lists of top ten genes with the highest fold-change, including both up- and downregulated genes. (C) Validation of the Affymetrix gene chip data by qRT-PCR using RNA extracted from E15.5 Fzd6+/– and Fzd6–/– back skins. (D) Expression of Cthrc1 in the skin is not affected by Fzd3 deletion. All data are mean±s.e.m. of three biological replicates. GAPDH was used as a control. Quantification of data between two groups was compared using the Student's t-test. The expression levels of Cthrc1 in panel D were compared using ANOVA followed by Tukey's test. *P<0.05; **P<0.01. n.s., not significant.

Identification of Cthrc1 as a potential downstream effector of Fzd6. (A) Transcriptome changes in response to the loss of Fzd6. Mouse MOE430 2.0 Affymetrix arrays were hybridized in three biologically independent experiments with RNA from E15.5 Fzd6+/– and Fzd6–/– back skins. As expected, the probe set representing Fzd6 transcripts shows reduced hybridization with RNA from Fzd6–/– skins. Blue, upregulated; red, downregulated expression. (B) Lists of top ten genes with the highest fold-change, including both up- and downregulated genes. (C) Validation of the Affymetrix gene chip data by qRT-PCR using RNA extracted from E15.5 Fzd6+/– and Fzd6–/– back skins. (D) Expression of Cthrc1 in the skin is not affected by Fzd3 deletion. All data are mean±s.e.m. of three biological replicates. GAPDH was used as a control. Quantification of data between two groups was compared using the Student's t-test. The expression levels of Cthrc1 in panel D were compared using ANOVA followed by Tukey's test. *P<0.05; **P<0.01. n.s., not significant.