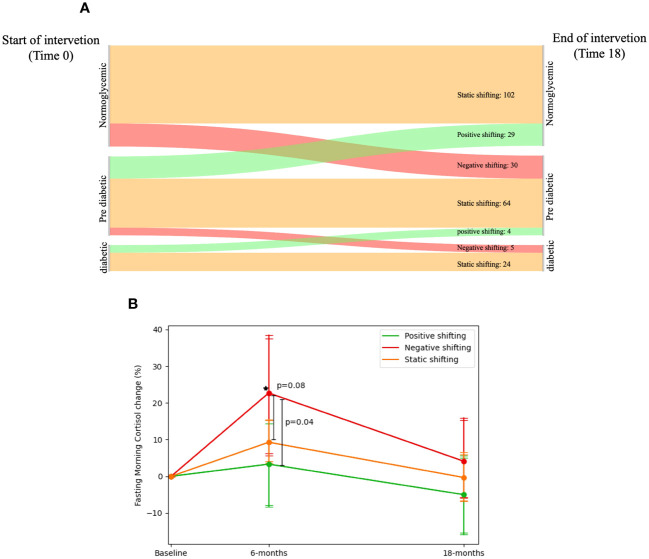
Figure 4.
Fasting morning cortisol and shifting of glycemic-status. 1. (A) Sankey diagram showing the glycemic-status shifting between three groups: Normoglycemic, Pre-diabetic and Diabetic; 190 participants had a static glycemic-status shift (started and finished in the same group: Normoglycemic → Normoglycemic = 102, Pre-diabetic → Pre-diabetic = 64 and Diabetic → Diabetic = 24), 35 participants who had negative glycemicstatus shifting (started in one group and finished in a worse-diagnosed group: Normoglycemic → Pre-diabetic = 30 and Pre-diabetic → Diabetic = 5), and 33 participants who had a positive glycemic-status shifting (started at one group and finished at a better-diagnosed group: Pre-diabetic → Normoglycemic = 29 and Diabetic → Pre-diabetic = 4). 2. (B) FMC dynamics in percent across glycemic-status shifting groups. Between P values analyzed in ANCOVA model adjusted for age, gender, Intervention group and Dweight. 3. Diabetic defined as fasting glucose >=126 or HbA1c >=6.5 or receiving medical treatment for diabetes. 4. Pre-diabetic defined as 126>fasting glucose >=100 or 6.5>HbA1c>=5.7. 5. * significant within change vs. baseline at 0.05; Negative shifting group had elevated FMC levels in 6-months vs. Baseline.

