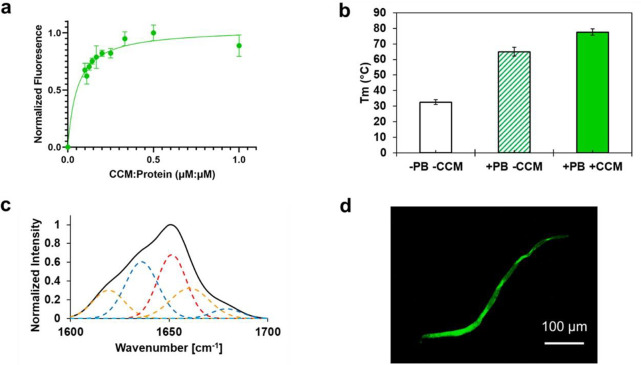
Figure 3.
(a) Spectroscopic fluorescence of Q2TFL at different curcumin:protein molar ratios. Fluorescence was measured by excitation at 450 nm and emission at 520 nm. Error bars represent the standard deviation and are the result of three independent trials. (b) Melting temperature of Q2TFL in the presence of phosphate buffer (PB) with and without CCM. Melting temperature is measured by CD and error bars are the result of three independent trials. (c) Representative ATR-FTIR spectra of Q2TFL•CCM. Overall spectra by deconvolution are shown in black and individual peak deconvolutions in dotted red lines (α-helix), blue lines (β-sheet), and orange lines (random coil/turns). (d) Fluorescent confocal micrograph of Q2TFL•CCM showing fiber thickening to the mesoscale.

