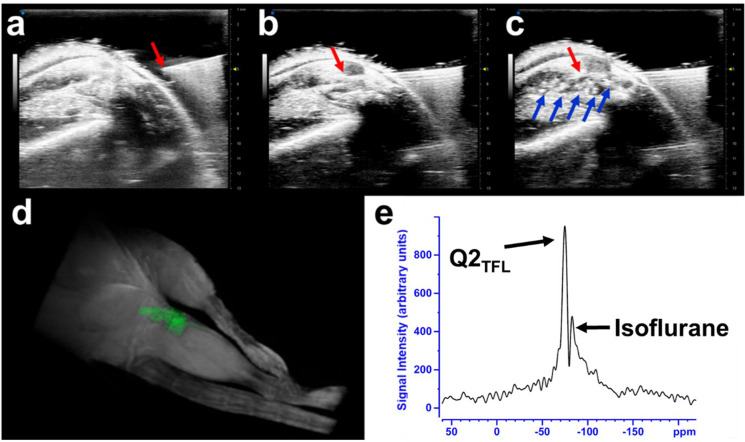
Figure 6.
Ultrasound guided injection imaging: (a) Sagittal view of the hindlimb right before the needle insertion which is adequately tilted at 45° to expose to joint and ease the infusion. (b) The needle insertion within the hindlimb knee joint. (c) Successful injection of Q2TFL into the hindlimb knee joint appearing as an echogenic signal using high frequency ultrasound. Red arrow indicates the syringe tip, and blue arrows indicate the presence of Q2TFL. (d) 3D rendering of 1H MRI imaging of the mouse hindlegs where Q2TFL fibers (highlighted in green) appeared as a hypointense signal in the 3D MRI data sets in the injected hindleg. (e) 19F MR spectroscopy performed in vivo after injection of Q2TFL using 10 min scan (TR = 100 ms, NAV = 6000).

