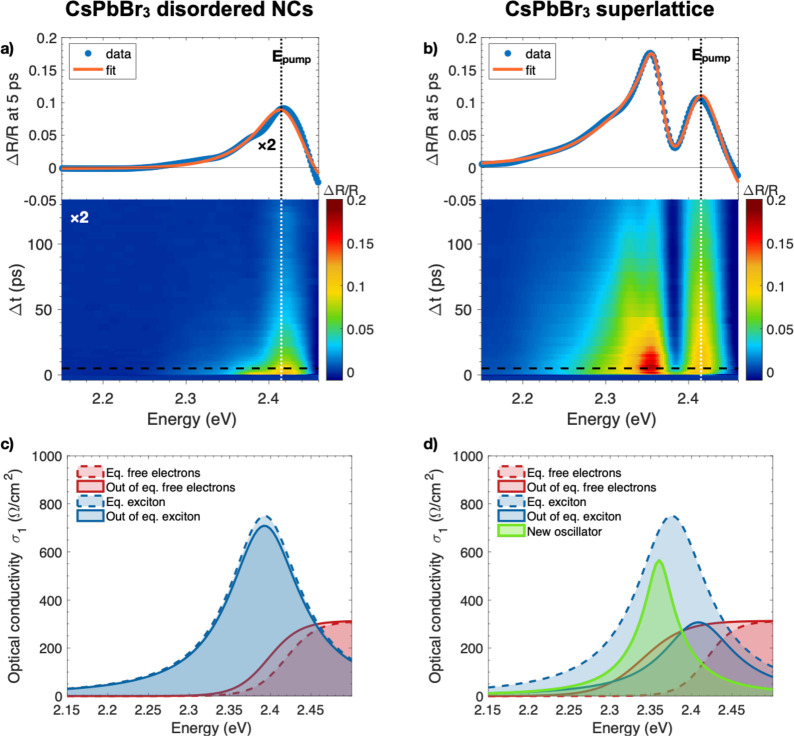
Figure 2.
Ultrafast transient reflectivity of CsPbBr3 disordered NCs sample (left panels) and NC superlattice sample (right panels), measured at 17 K, 230 μJ/cm2 excitation fluence and pump photon energy resonant with the excitonic line, i.e., Epump = 2.41 eV. The bottom (a) and (b) panels report the two-dimensional pump–probe maps displaying the ΔR/R signal (see color scale on the right) as a function of the delay (Δt) and probe photon energy. The top panels (a) and (b) report the ΔR/R signal (blue dots) as a function of the probe photon energy at fixed delay time, Δt = 5 ps (horizontal dashed line in the color maps). The orange solid lines represent the differential fit to the data. (c) and (d) optical conductivity (σ1) at equilibrium (dashed lines) and out-of-equilibrium at Δt = 5 ps (solid lines) obtained from experimental absorbance and fit of ΔR/R spectra. The colors represent the different contributions to the total optical conductivity: (i) main excitonic line (blue); (ii) across gap optical transitions (red); and the photoinduced peak emerging at low temperature in ordered NC superlattices (green).

