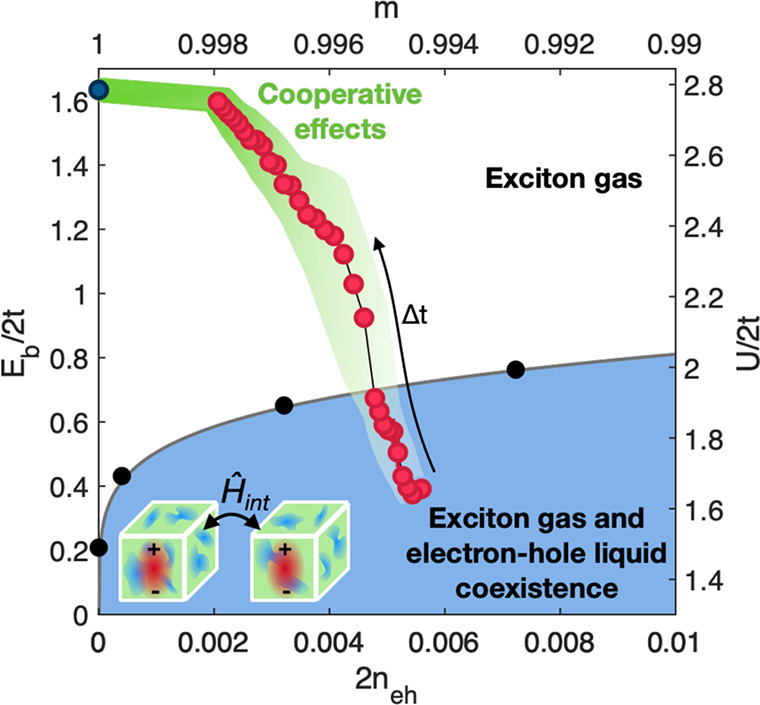
Figure 4.

Phase diagram showing the electron gas (EG) and electron–hole liquid (EHL) regions. The electron–hole density 2neh and the exciton binding energy Eb correspond to magnetization m and on-site interaction U in the equivalent Hubbard model. The black points are taken from ref (48). The red dots are the experimental data points representing the trajectory the system follows while relaxing to the equilibrium EG phase from the photoinduced EHL phase. The plotted values are the binding energy values extracted from the time-resolved fit of the pump–probe data on NC superlattices at 230 μJ/cm2 fluence, as a function of the estimated electron–hole density at the corresponding Δt. The green shaded area represents the phase-space region compatible with the outputs of the time-resolved experiment when the error bars associated with neh and Eb are considered.
