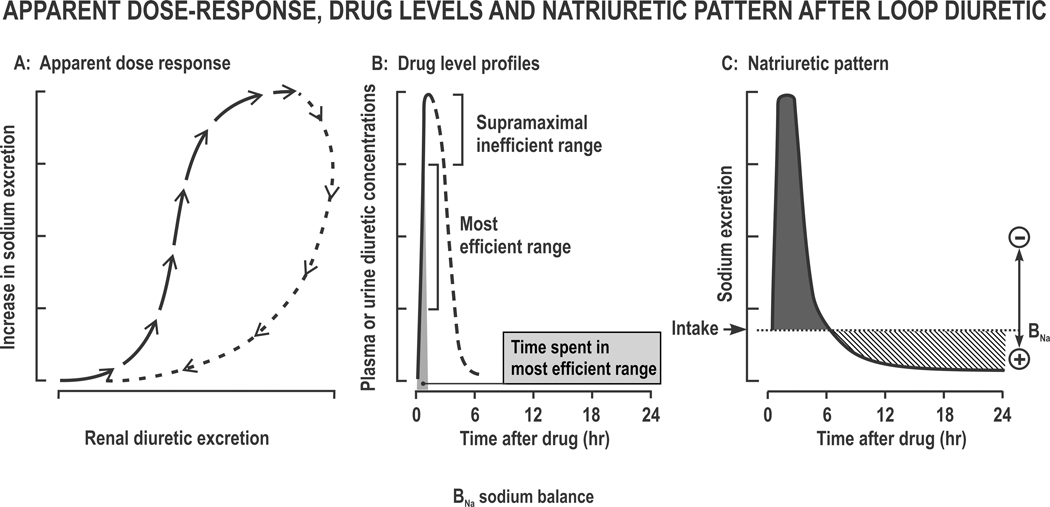
Figure 3. Apparent Dose-Response, diuretic plasma or urine levels and natriuretic pattern after a loop diuretic:
The apparent dose-response relationship at time points after a single dose (Panel A), the profile of diuretics with the most efficient levels corresponding to the middle 50% of the rising phase (Panel B) and the natriuretic pattern of brief sodium loss (negative balance) followed by Na+ retention (positive balance) (Panel C).

