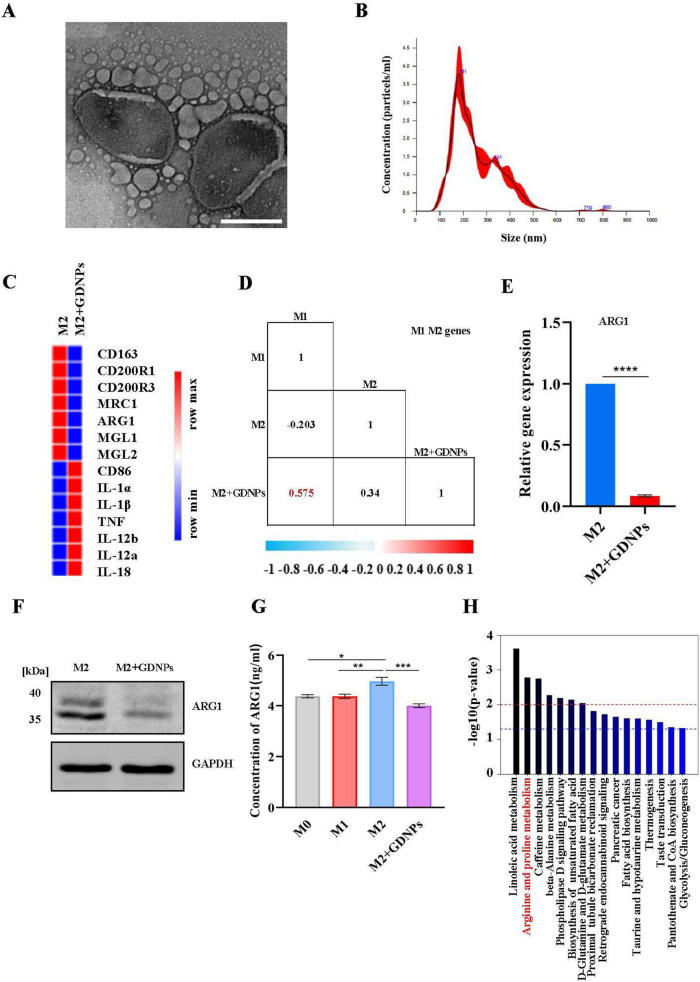
Fig. 2.
GDNPs reprogrammed TAMs to reduce ARG1 production. a TEM image of GDNPs were purified with differential ultracentrifugation. b The size and concentration of GDNPs were detected by NTA technology. c Heat map analysis of M1-M2 related genes expression from M2-like macrophages treated with or without GDNPs. d Pearson’s correlation analysis of gene expression matrices between samples using M1-M2 markers set derived from M2-like macrophages. Values range from 0 to 1, where a high value indicates high degree of correlation between two sample sets. e q-PCR analysis of Arg1 mRNA expression in M2 macrophages treated with or without GDNPs (10 μg/mL) for 12 h. f Expression of ARG1 in the M2 and M2 + GDNPs are detected by western blotting. g Concentration of ARG1 in the supernatants was analysed by ELISA. h The histogram showed metabolite-enriched KEGG pathways in tumors of wild-type tumor-bearing mice and GDNPs-treated mice. The results represent three independent experiments as the mean ± SEM. One-way ANOVA (g) and Student’s t test (e, f) were used to compare results of different experimental groups for statistically significant difference (*P < 0.05, **P < 0.01, ***P < 0.001)

