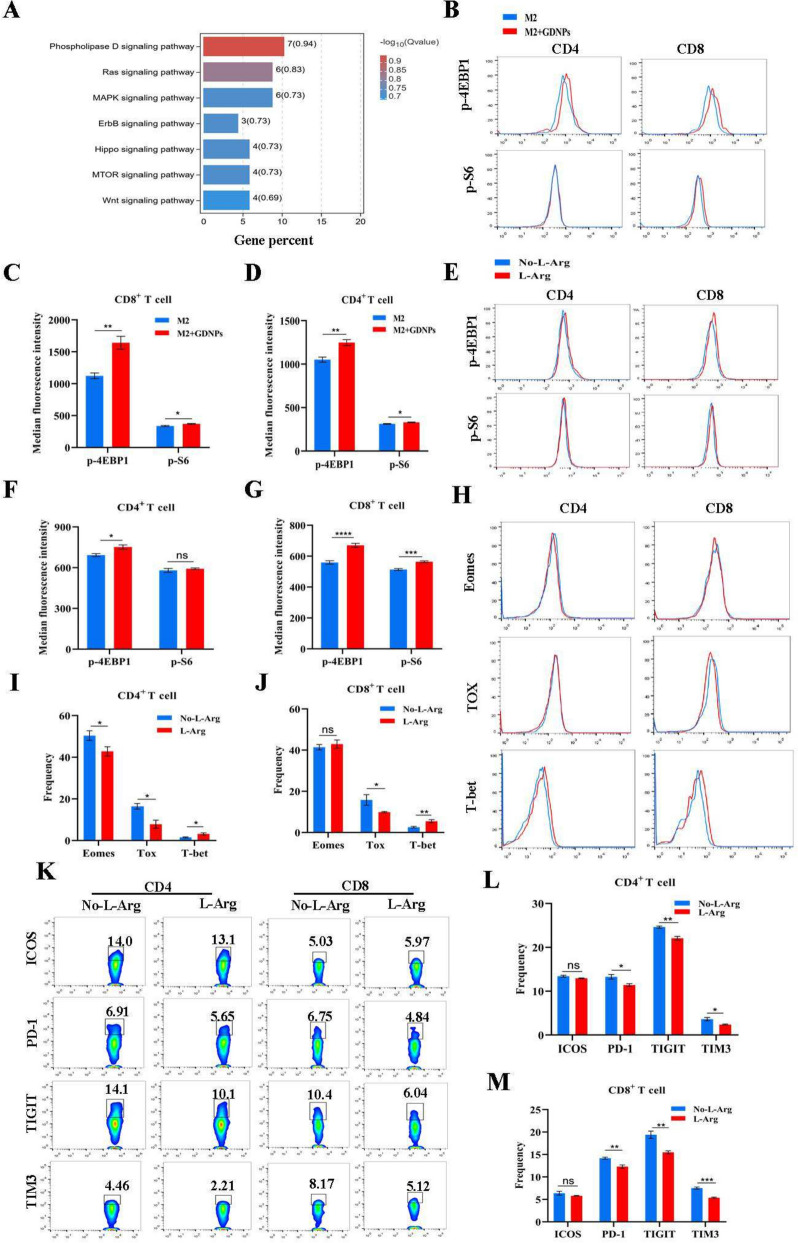
Fig. 6.
The relieve effect of GDNPs on T cell exhaustion dependent on the mTOR-T-bet axis. a KEGG enriched T cells cultured with the supernatant of M2-like macrophages stimulated with or without GDNPs. b, c, d Splenocytes were cultured with M2 supernatant or M2 + GDNPs supernatant for 48 h. Representative histograms and quantification showing the levels of p-4EBP1, p-S6 in CD4 + and CD8 + T cells with or without GDNPs. e, f, g Representative histograms and quantification showing the levels of p-4EBP1, p-S6 in CD4 + and CD8 + T cells with or without L-Arginine. h, i, j Representative histograms and quantification of Emoes, Tox, and T-bet expression in CD4 + and CD8 + T cells with or without L-Arginine. k, l, m Representation of ICOS, PD-1, TITGT and TIM3 expression on CD4 + and CD8 + T cells with or without L-Arginine. The graphs show the frequency of ICOS, PD-1, TITGT, and TIM3 on CD4 + and CD8 + T cells. All results represent the mean ± SEM. Student’s t test (c, d, f, g, i, j, l, m) were used to compare results of different experimental groups for statistically significant difference (*P < 0.05, **P < 0.01, ***P < 0.001, ****P < 0.0001)

