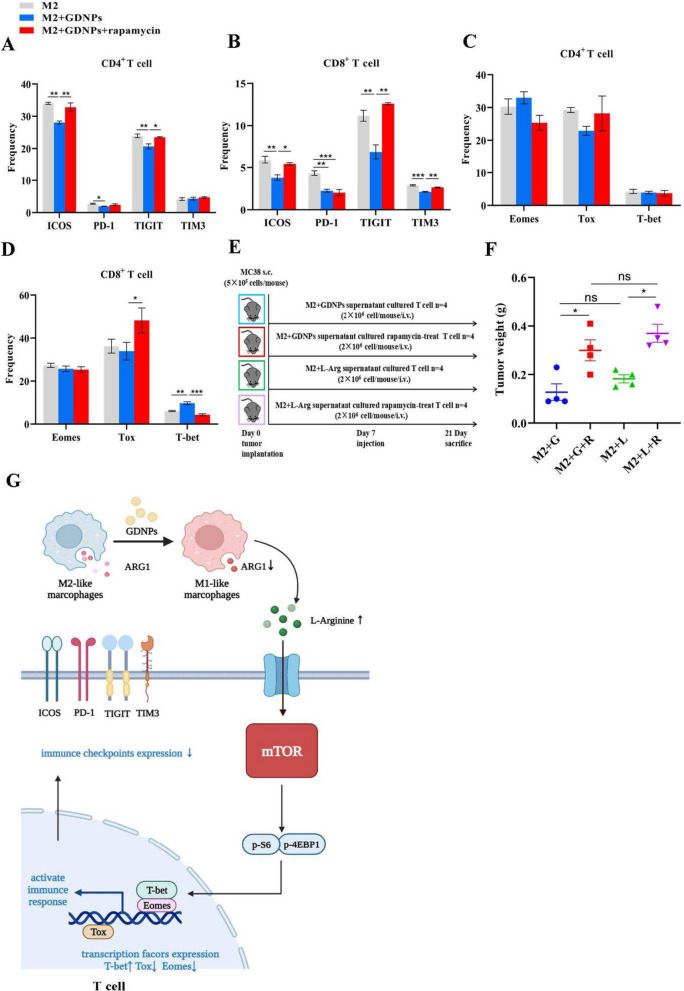
Fig. 7.
Inhibition of mTOR activity in T cells ineffectively restored the anti-tumor effect of GDNPs. a, b, c, d After the monocytes were polarized by M2-like macrophages, M2 supernatants and M2 + GDNPs supernatants with or without Rapamycin (10 nM) were added to incubate splenocytes. a, b The proportion of ICOS, PD-1, TIGIT, TIM3 on CD4 + and CD8 + T cells in three groups. c, d The proportion of Eomes, Tox and T-bet in CD4 + and CD8 + T cells in three groups. e Schematic illustration of back-transfusion of four T cells into MC38 colon tumor model mice. f Tumor weight of M + G, M + G + R, M + L, and M + L + R four groups. g The schematic diagram showed the mechanism by which GDNPs relieved T cell exhaustion by reprogramming macrophages. The figure was created using BioRender.com (https://biorender.com). All results represent three independent experiments as the mean ± SEM. One-way ANOVA (a, b, c, d) were used to compare results of different experimental groups for statistically significant difference (*P < 0.05, **P < 0.01, ***P < 0.001)

