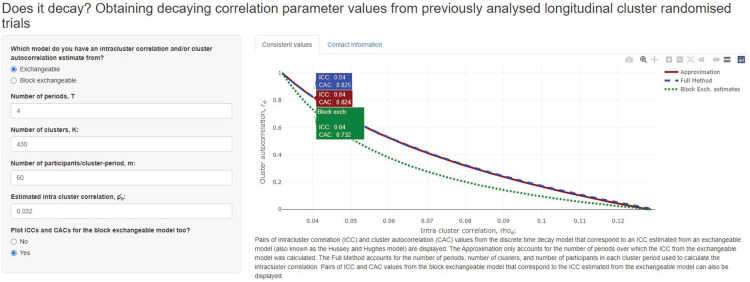
Figure 1.
The pairs of intracluster correlation and cluster autocorrelation values that are aligned with the intracluster correlation obtained for the Hb1Ac outcome in. One particular set of values is highlighted: and are consistent with when , and (using equation (10)). This is very close to the pair of values obtained using the approximation in equation (11): and are consistent with when . This plot also displays the block exchangeable correlation parameters that correspond to the estimated aggregate intracluster correlation.

