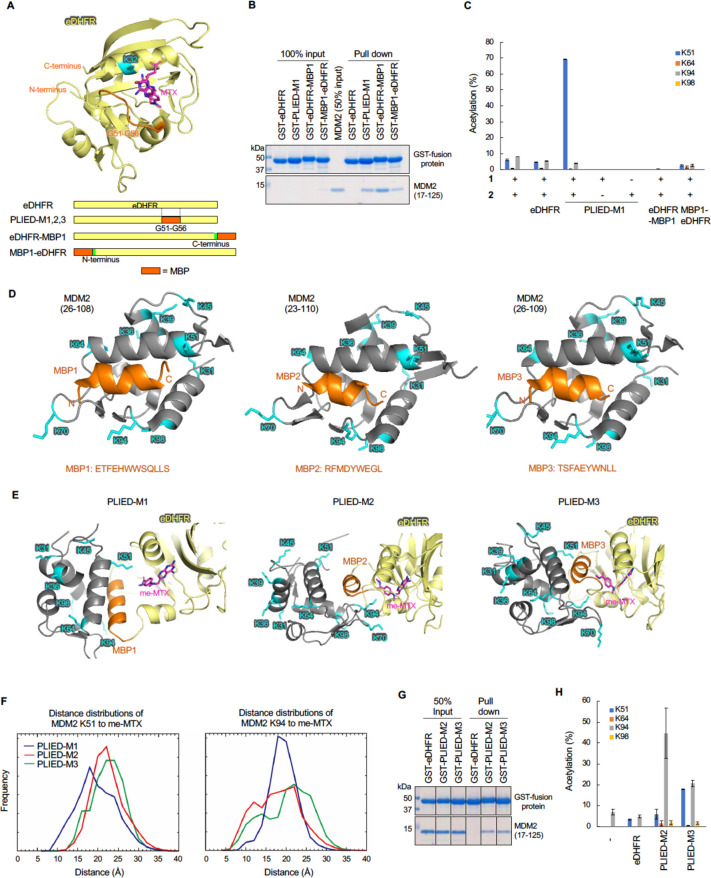
Figure 2.
Development of the PLIED/CAT system in vitro. A, Crystal structure of the eDHFR-MTX ligand complex (upper, PDB ID: 1rg7) and schematic representation of MDP-conjugated eDHFR (lower). eDHFR (pale yellow), K32 (cyan), G51–G56 loop region (orange), and MTX (magenta, chemical structure is shown in Figure S1B) are shown and labeled. B, GST-pull down assay with GST-eDHFR derivatives and MDM2. Recombinant human MDM2 (17–125) protein was incubated with glutathione Sepharose-immobilized GST-eDHFR derivatives. After extensive washing, bound proteins were analyzed by SDS-PAGE followed by CBB staining. C, Quantification of MDM2 acetylation by the eDHFR derivatives and TMP-BAHA 1. Recombinant MDM2 (17–125, 1.4 μM) was incubated with eDHFR, PLIED-M1, eDHFR-MBP1, or MBP1-eDHFR (4 μM) in the presence of TMP-BAHA 1 (10 μM) and acetyl donor 2 (100 μM) at 37 °C for 5 h. Acetylation yields of indicated lysine residues were analyzed by LC-MS/MS. Error bars represent the range of two independent experiments. D, Crystal structure of MDM2 binding with MBP1 (left, PDB ID: 3jzs), MBP2 (middle, PDB ID: 1t4f), or MBP3 (right, PDB ID: 3eqs). MDM2, lysine residues, and MBP are shown in gray, cyan, and orange with label, respectively. E, Modeled structures of PLIED/MDM2 complex. PLIED-M1/MDM2 (left), PLIED-M2/MDM2 (middle), or PLIED-M3/MDM2 (right) complex with eDHFR (pale yellow), me-MTX (magenta, chemical structure is shown in Figure S1B), MDM2 (gray), lysine residues of MDM2 (cyan), and MBP (orange) are shown. F, Distributions of the distances between lysines (K51 or K94) and me-MTX. The distances were measured between the ε-nitrogen atom of the lysines and the center of mass of the benzene ring of me-MTX. The distributions were computed for each of the three cases using the last 9 μs × 15 replicas = 135 μs long trajectories. G, GST-pull down assay with GST-PLIED and MDM2 as in B. H, Quantification of MDM2 acetylation by PLIED/CAT system as in C.

