
FIGURE 2.
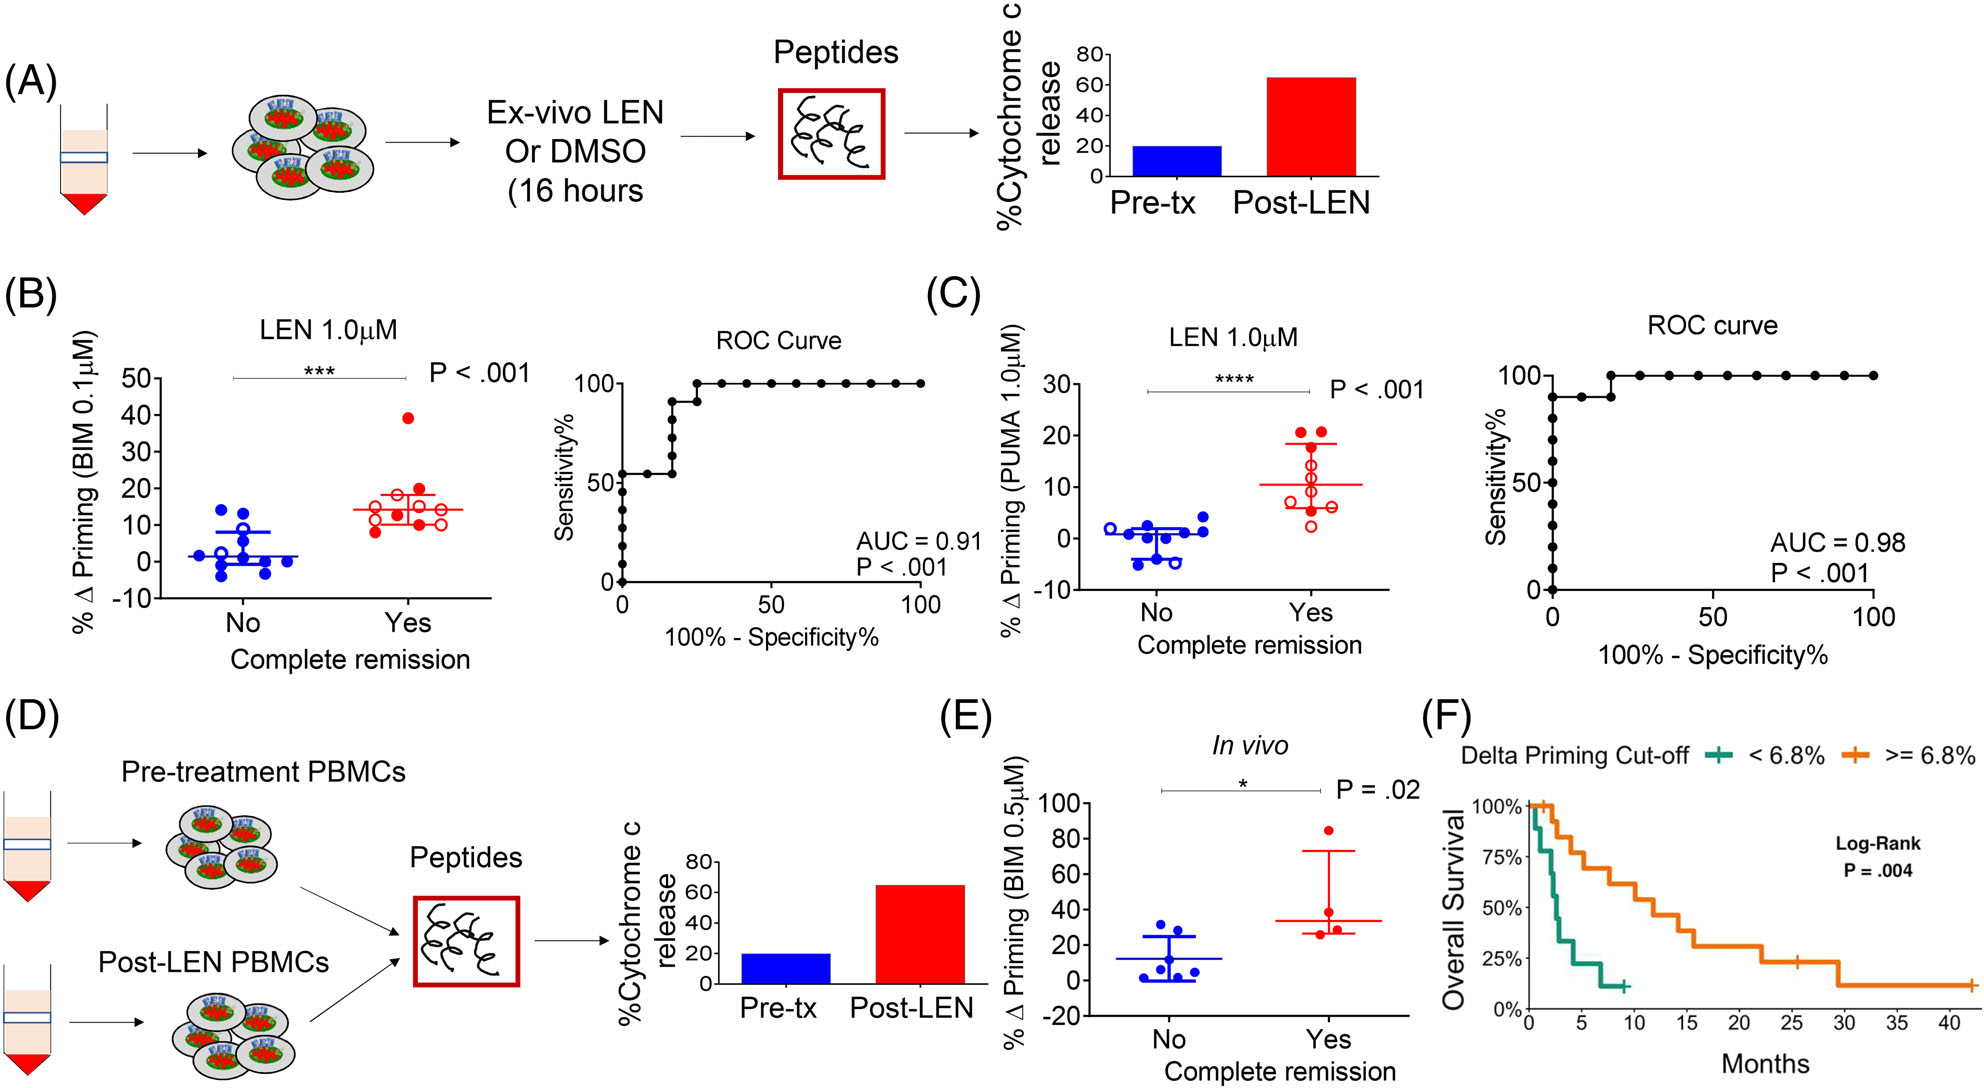
Lenalidomide-induced mitochondrial apoptosis priming correlates with clinical response. (A) Schematic of DBP assay performed on myeloblasts from patients treated on the two trials. (B and C) Correlation of % Δ priming and remission status of trial patients. The % Δ priming was derived from DBP analysis performed by first exposing pre-treatment myeloblasts to ex vivo LEN treatment, followed by measurement of priming response to BIM or PUMA peptides (left panels). The % Δ primingex vivo = % cytochrome c lossPost ex vivo LEN - % cytochrome c Post ex vivo DMSO. Corresponding ROC shows that DBP is a binary predictor of clinical response (right panels). Closed circles represent Stanford trial patients (n = 15) and open circles represent DF/HCC trial patients (n = 8). The DBP analysis using the PUMA peptide was restricted to 13 Stanford trial patients due to limited cell numbers. (D) Schematic of BH3 assays performed on myeloblasts collected from trial patients at pre-treatment stage and post-LEN alone (prior to MEC chemotherapy). (E) Correlation of in vivo % Δ priming (% Δ primingin vivo = % cytochrome c lossPost LEN - % cytochrome c losspre-treatment) with clinical response to LEN-MEC chemotherapy performed in paired samples collected from the Stanford trial (n = 11, restricted to those with leukemic blood at both pre-treatment and post-LEN/pre-MEC administration stages). (F) Using a recursive partitioning algorithm for categorizing response based on % Δ priming, a K-M curve was generated using the potential cut-point or threshold that distinguishes non-responders from responders. P-values were calculated using one-sided Wilcoxon-rank sum test. Horizontal line in B, C and E represents median with interquartile range