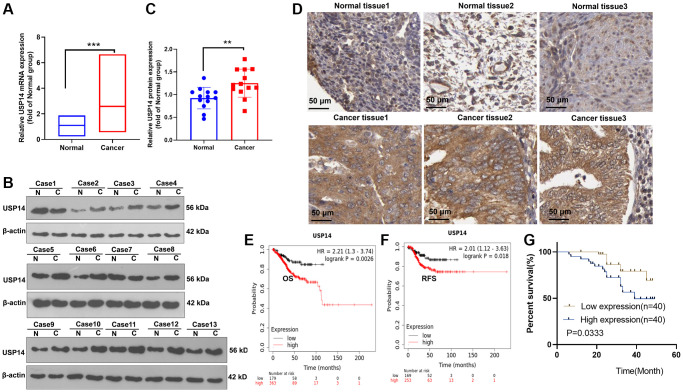
Figure 1.
Alteration of USP14 expression in EC. (A–C) qRT-PCR (A) and WB (B, C) confirmed the USP14 level in EC tissues and paired adjacent normal tissues. (D) The Human Protein Atlas was used to analyze the USP14 profile in EC tissues and normal endometrial tissues. (E, F) The K-M plotter survival curve was adopted to clarify the correlation between USP14 and the overall survival (OS) and relapse-free survival (RFS) rates of EC patients. (G) The association between the USP14 level and the prognosis of EC patients was determined. **refers to P < 0.01, ***represents P < 0.001. Abbreviations: N: Normal; C: endometrial carcinoma tissue.

