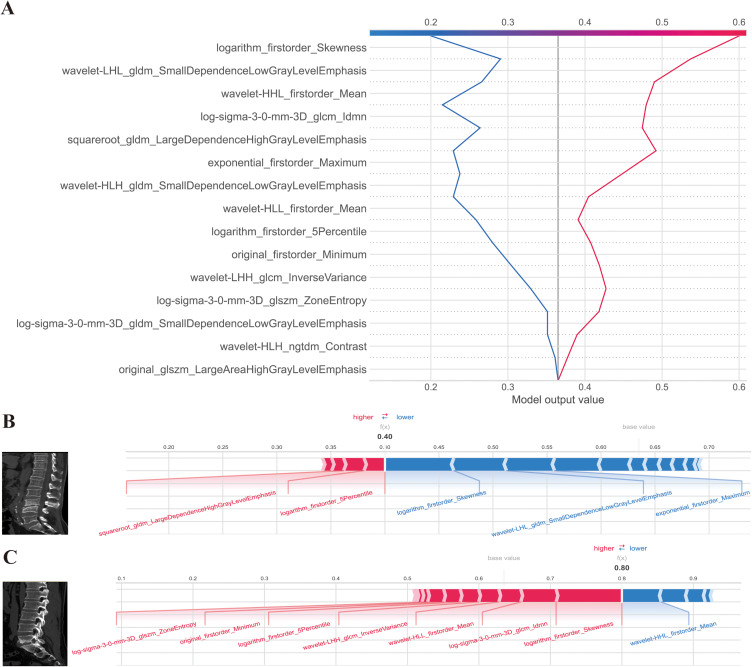
Figure 8.
SHAP decision and force plots. (A) Represents the SHAP decision plot for two patients in the testing set, where one is predicted with PS, and the other is predicted with BS; (B) Indicating the SHAP force plot for the PS patient, while the figure; (C) provides the SHAP force plot for the BS patient. Both patients presented with vertebral bone destruction, with one case observed at the L4-5 level and the other at the L5-S1 level. The destruction was characterized by the presence of bone hyperplasia and sclerosis along the edges. Particularly noteworthy is the predominant localization of the observed destruction along the intervertebral disc, implying a potential interplay between disc pathology and the underlying pathogenesis of the condition. The two-single case (one patient with PS and one patient with BS) prediction method was also shown in Figure 8A. Also, we offer two common instances to demonstrate the model’s interpretability: respectively, PS and BS patients. Each factor’s impact on prediction is shown with an arrow. According to the blue and red arrows, PS risk was either decreased (blue) or raised (red) by the factor.
Abbreviations: LIME, local interpretable model-agnostic explanations; SHAP, SHapley Additive exPlanations.

