Figure 3.
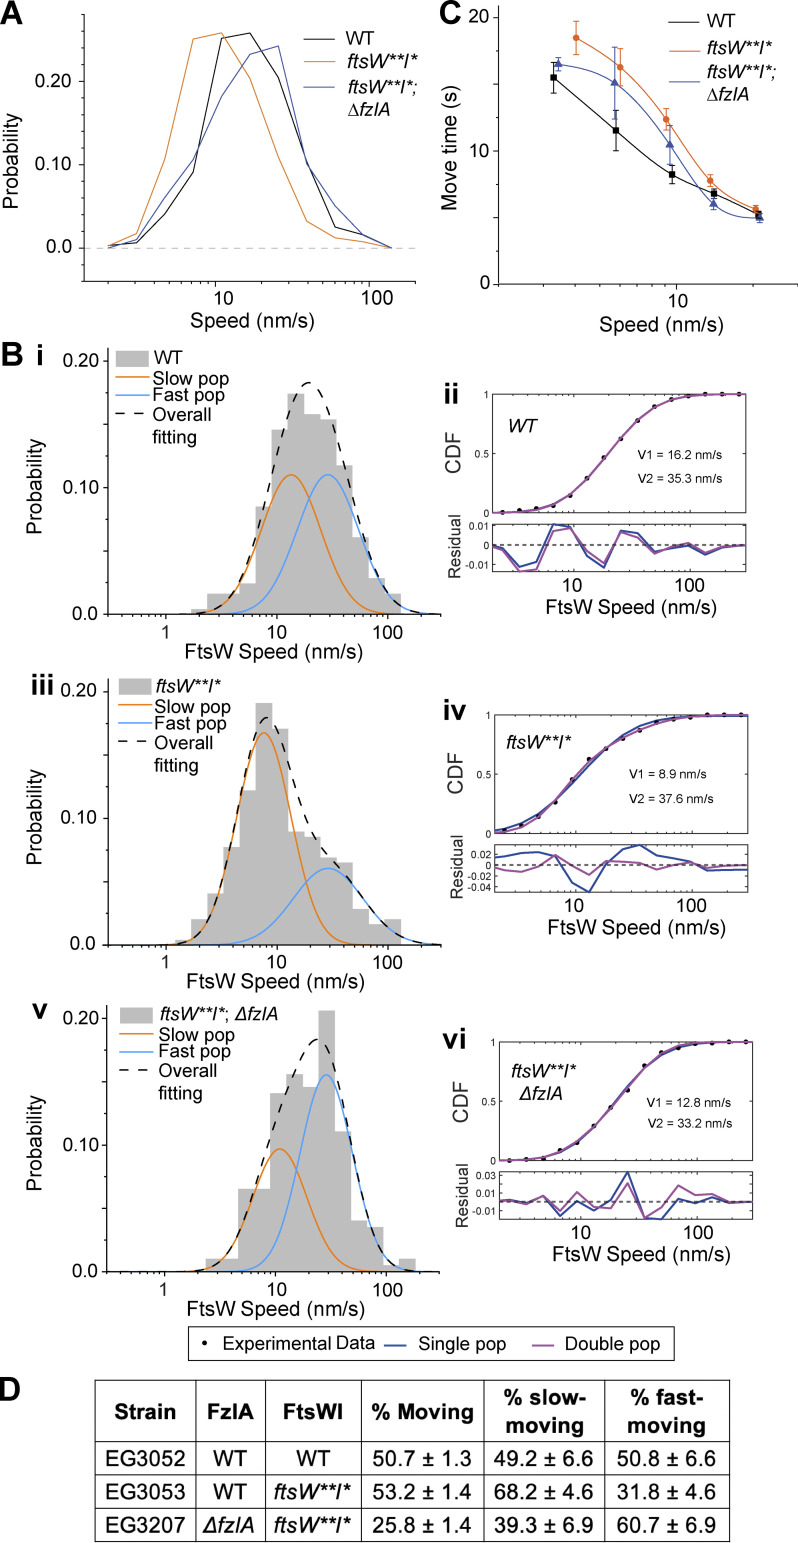
Mutations to FtsW or FzlA impact FtsW movement. (A) Histogram comparing single-molecule speeds of FtsW or FtsW** in halo-ftsW (WT; EG3052, n = 318 total from four biological replicates), halo-ftsW**; ftsI* (ftsW**I*; EG3053, n = 403 total from three biological replicates), or ΔfzlA; halo-ftsW**; ftsI* (ΔfzlA, ftsW**I*; EG3207, n = 198 total from three biological replicates) backgrounds. (B i, iii, and v) Two-population fitting of the histograms of A ((i) FtsW in WT, (iii) FtsW** in ftsW**I*, (v) FtsW** in ΔfzlA, ftsW**I*). Orange and blue curves represent the slow- and fast-moving populations, respectively. The black dashed curve is the overall fit of the distribution. (ii, iv, and vi) Goodness of fit (top) of two- (magenta) versus one- (blue) population fitting of Halo-FtsW speed distribution. The residuals of each fit (bottom) illustrate how well each model captures the data at every point along the CDF. Data in Fig. 2 C is duplicated in B. (C) Plot comparing the move time of single FtsW or FtsW** molecules at speeds <20 nm/s in halo-ftsW (WT; EG3052, n = 318 total from four biological replicates), halo-ftsW**; ftsI* (ftsW**I*; EG3053, n = 403 total from three biological replicates), or ΔfzlA; halo-ftsW**, ftsI* (ΔfzlA, ftsW**I*; EG3207, n = 198 total from three biological replicates) backgrounds. Error bars are SEM. (D) Fraction of the FtsW population that is moving overall (% moving), slow moving, or fast moving for the indicated strains and conditions.

