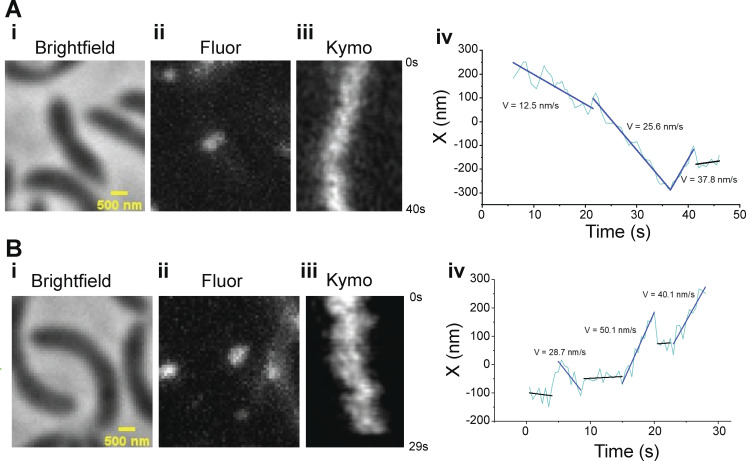
Figure S2.
Example trajectories of single molecules of Halo-FtsW showing FtsW may change speeds. (A and B i) Brightfield image of a halo-ftsW background cell (EG3052). (ii) Representative maximum fluorescence intensity projection image (Fluor) for single labeled Halo-FtsW. (iii) Kymograph (Kymo) of the fluorescence signal of a line scan across the division plane that encapsulates a labeled single molecule of Halo-FtsW**. (iv) Plot of the molecule position within the line scanning over the course of SMT.

