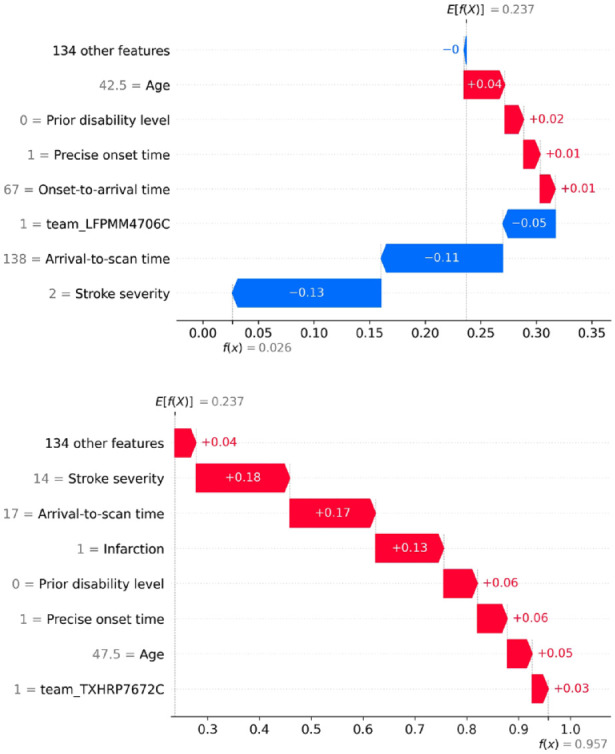
Figure 1.

Waterfall plots showing the influence of each feature on the predicted probability of a single patient receiving thrombolysis. Top: An example of a patient with a low probability (2.6%) of receiving thrombolysis. Bottom: An example of a patient with a high probability (95.7%) of receiving thrombolysis.
