
Figure 2.
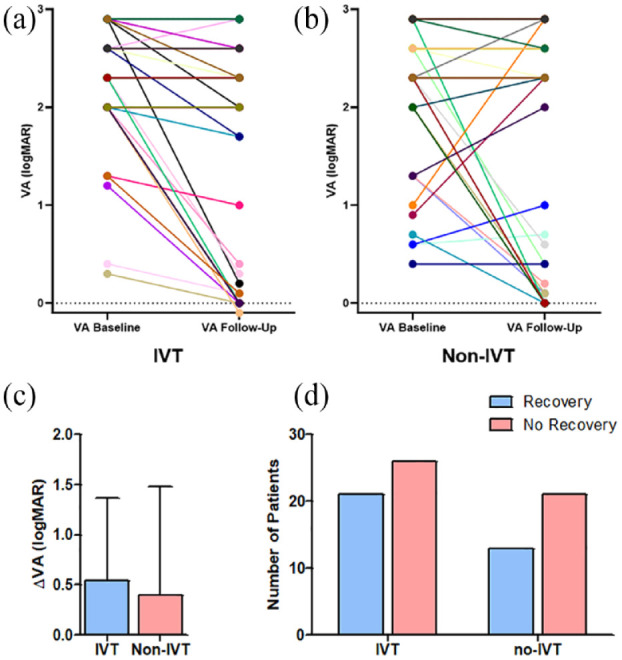
Visual acuity at baseline and follow-up. VA of each individual patient at baseline and follow up (a and b). Please note that data from more than one patient with similar VA course may overlay. IVT patients as well as non-IVT patients had a significantly improved VA at follow-up compared to baseline (∆VA 0.5 ± 0.8, p < 0.001) for IVT patients, ∆VA 0.40 ± 1.1, p < 0.05 for non-IVT patients). When comparing the ∆VA (c) and number of patients with visual recovery at follow-up (d), no significant differences between IVT and non-IVT patients were found (∆VA 0.5 ± 0.8 for the IVT group vs 0.4 ± 1.1 for the non-IVT group, p = 0.196, 21/47 (44.7%) IVT patients with visual recovery vs 13/34 (38.2%) non-IVT patients with visual recovery, p = 0.562). IVT: intravenous thrombolysis; logMAR: logarithm of minimum angle of resolution; VA: visual acuity.