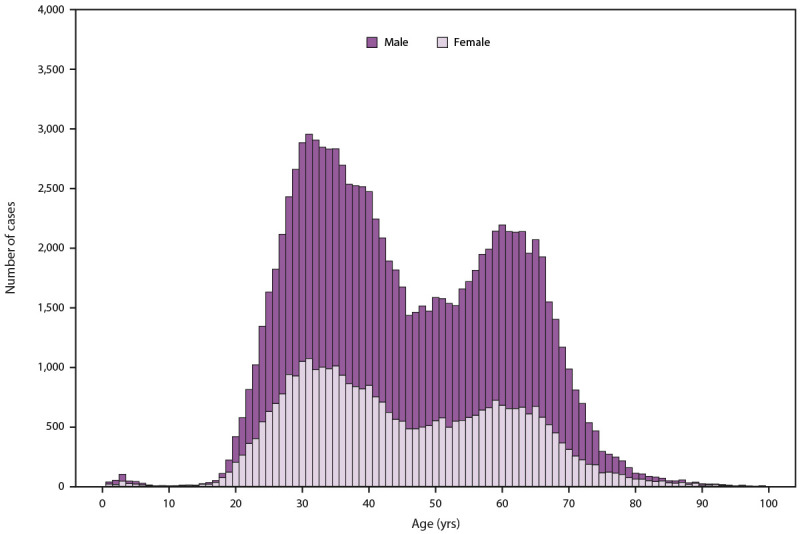
FIGURE 2.

Number of laboratory confirmed* chronic hepatitis C virus infection cases,† by sex and age — United States, 2021§,¶
Source: National Notifiable Diseases Surveillance System, CDC.
* During 2021, cases of chronic hepatitis C were either not reportable by law, statute, or regulation; not reported; or unavailable to CDC from Arizona, District of Columbia, Hawaii, Indiana, Kentucky, North Carolina, Rhode Island, and Texas.
† Only laboratory confirmed, newly diagnosed, chronic hepatitis C cases are included. For the case definition, see https://ndc.services.cdc.gov/conditions/hepatitis-c-chronic/.
§ The number of viral hepatitis cases reported to CDC in 2020 and 2021 might be lower than in years before the COVID-19 pandemic began. The decrease might be related to fewer people seeking health care and being tested for viral hepatitis during the COVID-19 pandemic.
¶ Changes in case definitions should be considered when examining temporal trends. For more information regarding the case definitions used in 2021, see https://www.cdc.gov/nndss/index.html.
