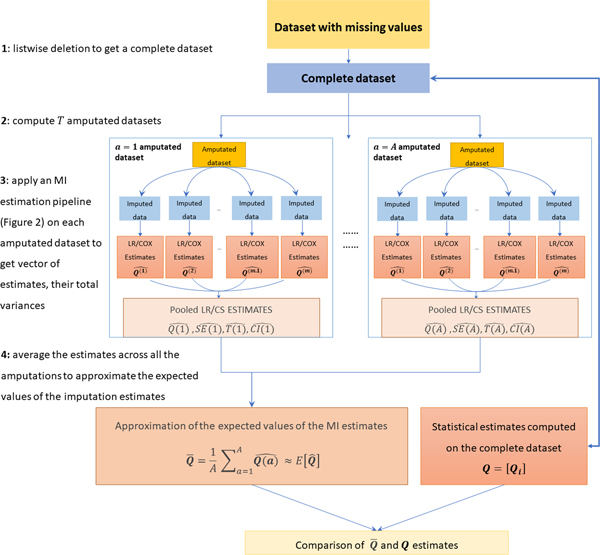
Figure 3:
Schematic diagram of the pipeline used to evaluate one MI algorithm across A multiple amputation settings. The following steps are applied: 1) listwise deletion is used to produce a complete dataset on which a vector of estimates to be used as “gold standard” is computed; 2) a number A of amputated datasets is computed by using an amputation algorithm that reproduces the same missingness pattern in the original dataset; 3) An MI estimation pipelines (see Figure 2) are applied to get A pooled estimates, their total variances, standard errors and confidence intervals; 4) averaging the A estimates the expected value of the MI estimates are approximated and compared to the gold standard estimates computed on the complete dataset (step 1).

