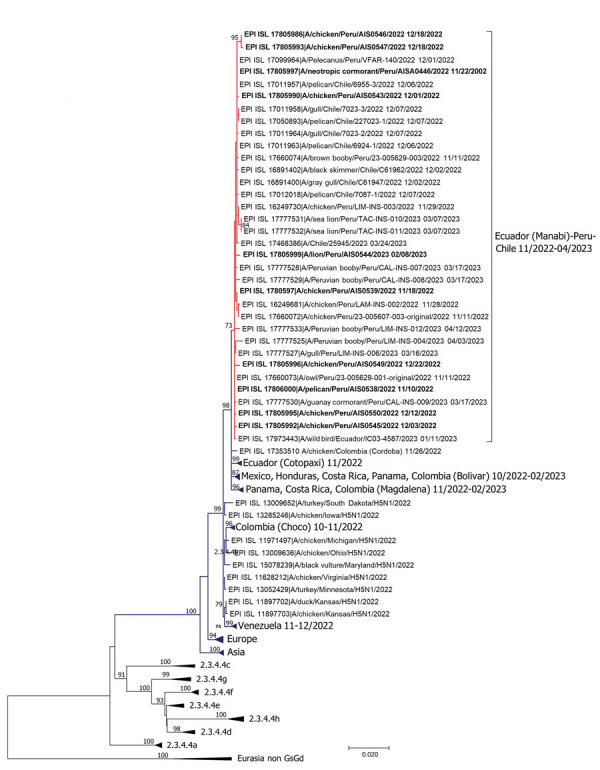
Figure.

Phylogenetic analysis of highly pathogenic avian influenza A(H5N1) from wild birds, poultry, and mammals, Peru. Maximum-likelihood method was used for phylogeny of 101 hemagglutinin H5 sequences from avian influenza viruses. Red lines indicate clustering of strains from Peru and sequences from this study; bold font indicates the sequences from this study. Dark blue lines indicate other strains from South and North America. Non–goose/Guangdong lineage virus strains from Eurasia were outgroups. Phylogenetic tree was generated and edited with MEGA X software (https://www.megasoftware.net). Sequences were aligned by using the MUSCLE program in the AliView alignment viewer and editor (https://www.ormbunkar.se/aliview). We used general time reversible and gamma distribution models; robustness of tree topology was assessed with 1,000 bootstrap replicates. Only bootstrap values >70% are shown. Scale bar indicates nucleotide substitutions per site.
