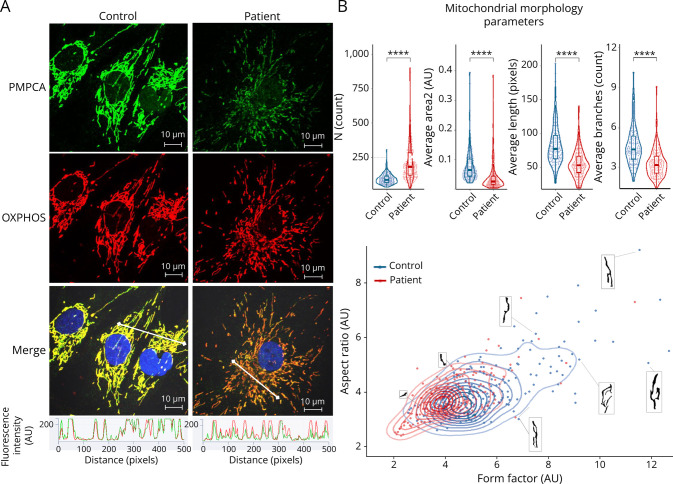
Figure 3. Immunofluorescence Staining.
(A) Immunofluorescence staining shows fragmentation of mitochondria in the patient fibroblasts. The α-MPP levels are lower in the patient, but analysis of fluorescence profiles (white line in the merged images) shows the correct localization of α-MPP (green) in mitochondria (red). (B) Mitochondrial morphometry measurements confirm statistically significant differences in the mitochondrial morphology of the patient and control fibroblasts. Each dot represents the average value for a single measured cell. α-MPP = α-subunit of mitochondrial processing peptidase.

