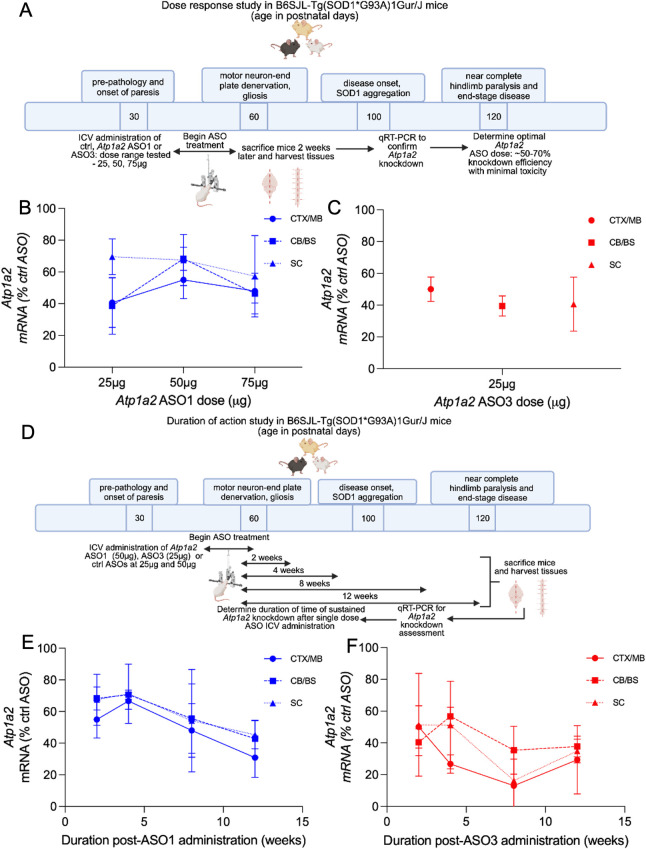
Fig 3. In vivo validation of Atp1a2 knockdown.
(A) Overview of dose response study (n = 3–4 female mice/group, 6–9 weeks old mice, prior to disease onset). B-C. Atp1a2 mRNA levels in CNS regions 2 weeks after ICV treatment with ASO1 (B) or ASO3 (C), represented as percentages of that in respective ctrl ASO mice. (D) Overview of duration of action study (n = 3 female mice/group, 6–9 weeks old mice, prior to disease onset). E-F. Atp1a2 mRNA quantification at 2, 4, 8 and 12 weeks after CNS delivery of ASO1 (E) or ASO3 (F) represented as percentages of that in respective ctrl ASO mice. CX/MB, cortex/midbrain, CB/BS, cerebellum/brainstem, SC, spinal cord.

