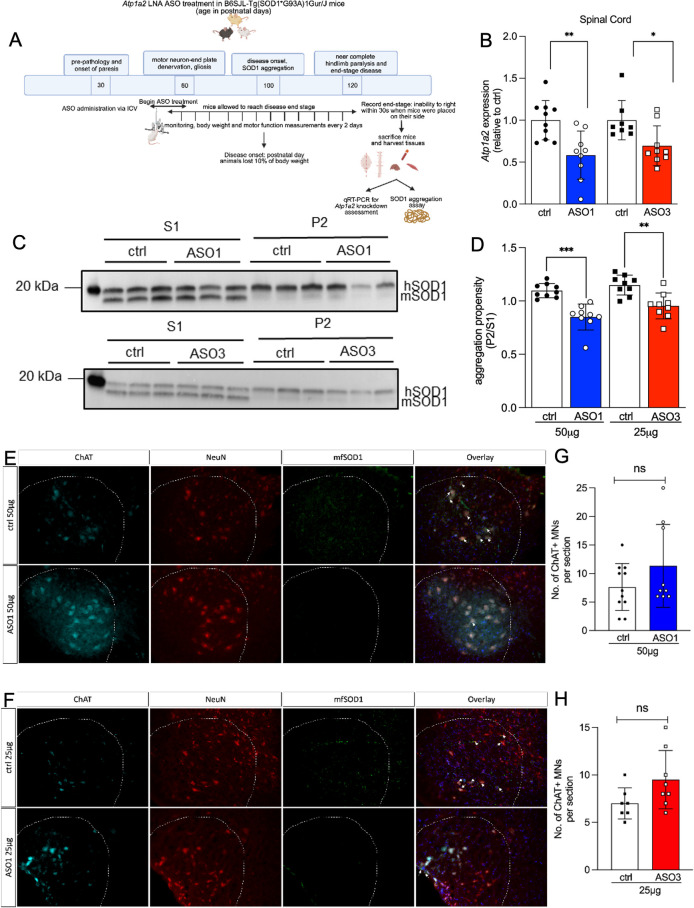
Fig 4. Reduced SOD1 aggregation in SOD1*G93A mice treated with Atp1a2 ASOs without altering motor neuron loss.
(A) Overview of experimental design. ASO1 (50μg, n = 23 mice:10 females, 13 males), ASO3 (25μg) or ctrl ASO (50 and 25μg; n = 21 mice: 10 females, 11 males in ASO3 and each control group) were delivered via ICV in 5–8 weeks old SOD1*G93A mice, prior to disease onset. (B) Atp1a2 mRNA measured in spinal cords from end-stage SOD1*G93A mice treated with ASO1 (50μg), ASO3 (25μg) or ctrl ASO. Unpaired t-test with Welch’s correction, **p < 0.01, *p<0.05 (C). Representative immunoblots of detergent soluble and insoluble fractions of spinal cords from end-stage SOD1*G93A mice treated with single dose ICV injection of ASO1 (top panel) or ASO3 (bottom panel). (D) Quantification of relative aggregation propensity ‐ an index of the amount of SOD1 in the detergent-insoluble fraction (P2) compared to the detergent-soluble fraction (S1), n = 9 mice per group. Unpaired t-test with Welch’s correction, ***p<0.001, **p < 0.01. (E, F) Immunohistochemistry for motor neuron markers (NeuN, red and ChAT, cyan) and misfolded SOD1 (mfSOD1 C4F6, green) in spinal cord tissue from ctrl and ASO1- (E) or ASO3-treated (F) mice; DAPI-stained nuclei shown in blue in overlay images. (G, H) Quantification of ChAT+ motor neurons (MNs)/section in ASO1 v ctrl-treated mice in (G) and ASO3 v ctrl-treated mice in (H). Representative images at 20x magnification from n = 3 mice for ASO1 v ctrl and n = 2 mice for ASO3 v ctrl are shown in (E, F), scale bar represents 100μm and 3–4 sections per mouse were counted in a blinded manner, ns = not significant by unpaired t-test with Welch’s correction.

