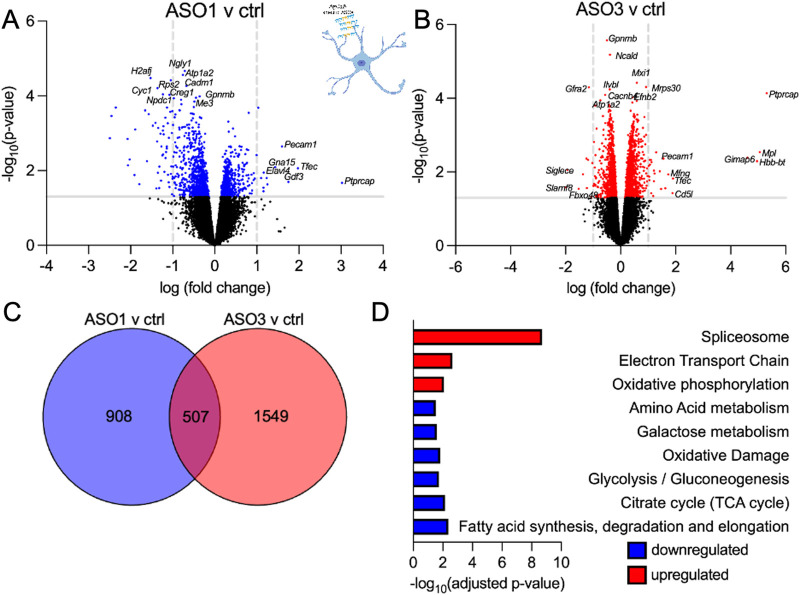
Fig 7. Atp1a2 knockdown induces transcriptomic changes in primary mouse astrocytes from SOD1*G93A mice.
Volcano plots showing differentially expressed genes between ASO1 (A) or ASO3 (B) vs ctrl ASO-treatment (total = 15085 variables, shown in blue and red are genes with p-value <0.05) in primary SOD1*G93A mouse astrocytes. (C) Venn diagram displaying the genes commonly altered in response to ASO1 and ASO3 treatment. (D) Pathway analyses of the differentially expressed genes shared between ASO1 and ASO3.

