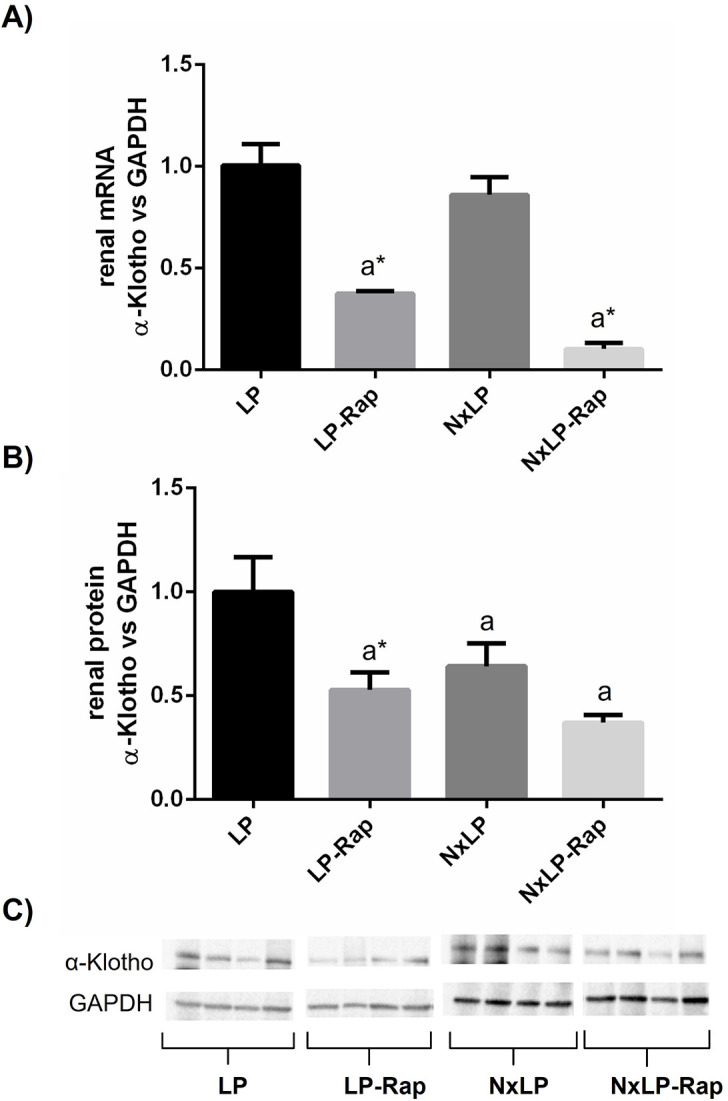
Fig 9. Renal expression of α-klotho at mRNA and protein level in rats fed low phosphorus.

Renal expression of α-klotho at (A) mRNA and (B) protein level in rats fed 0.2% phosphorus with intact (NP) and reduced (NxNP) renal function receiving either placebo or rapamycin (Rap). aP<0.05 vs NP; *P<0.05 vs its placebo counterpart. (C) Representative images of Western Blot (the complete Western Blot results are shown as Supplementary Data, S1 Raw images).
