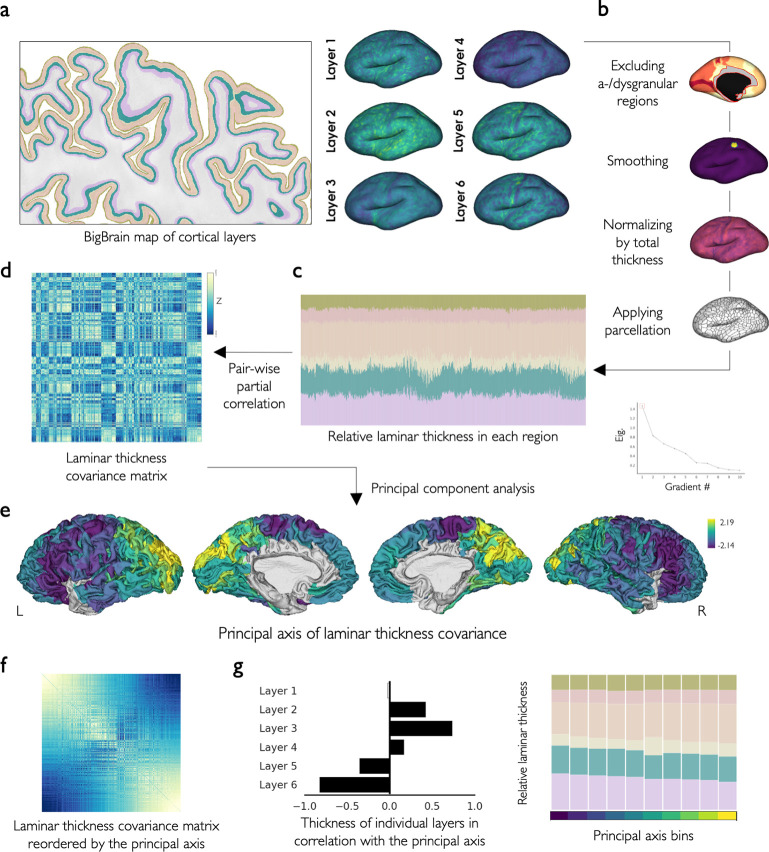
Fig 1. Laminar thickness covariance and its principal axis.
(a) The laminar thickness maps based on the postmortem histological atlas of BigBrain. (b, c) For each cortical layer, the a-/dysgranular regions were excluded, the thickness map was smoothed using a disc, normalized by the total thickness, and parcellated. (d) The LTC matrix was created by calculating the pairwise partial correlation of relative thickness across layers and between regions. (e) The main axis of laminar thickness covariance (LTC G1) was calculated by principal component analysis. (f) LTC G1 reorders the LTC such that closer regions on this axis have similar LTC patterns. (g) LTC G1 characterized a shift of infra- to supragranular dominance. The data and code needed to generate this figure can be found in https://zenodo.org/record/8410965.

