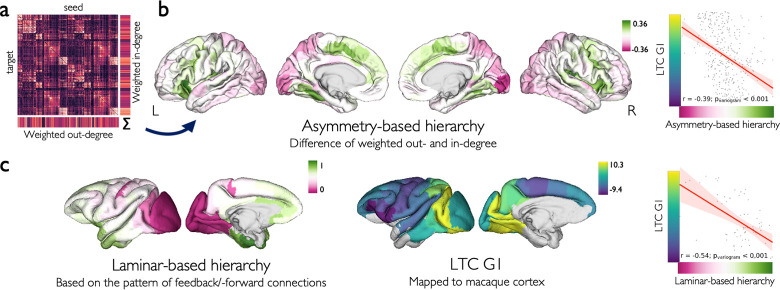
Fig 3. Association of laminar thickness covariance and cortical hierarchy.
(a) The group-averaged effective connectivity matrix based on regression dynamic causal modeling. (b) Regional asymmetry-based hierarchy was calculated as the difference between their weighted unsigned out-degree and in-degree and was significantly correlated with the LTC G1. (c) Regional laminar-based hierarchy map of macaque (left hemisphere) was correlated with the LTC G1 aligned to the macaque cerebral cortex. The data and code needed to generate this figure can be found in https://zenodo.org/record/8410965.

