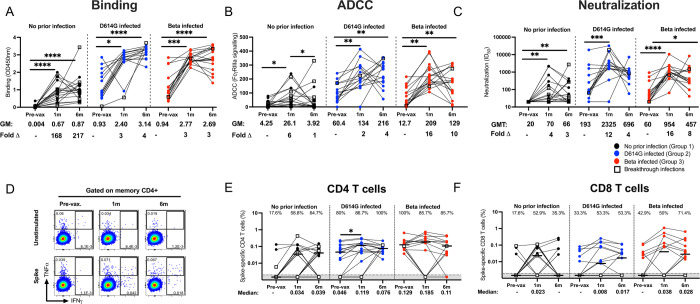
Fig 1. Durability of antibody and T cell responses 6 months after a single Ad26.COV2.S dose.
Participants with no prior infection (black, Group 1), infected with D614G (blue, Group 2) or infected with Beta (red, Group 3) were tested for binding (A), antibody-dependent cellular cytotoxicity (ADCC) activity (B), and neutralization (C) of the D614G variant. Ancestral spike-specific CD4 (D and E) and CD8 (F) T cell responses before vaccination and at 1 and 6 months after vaccination. For antibody responses, geometric mean (GM) values and fold changes are shown below the graphs. Fold changes were all calculated relative to the pre-vaccination timepoints. Binding antibodies were quantified by OD450nm values, ADCC activity was measured in FcγRIIIa signaling and neutralization was indicated by 50% inhibitory dilution (ID50) values. All serology experiments were performed in duplicate. For T cell responses, the proportion of responders (%) is shown within the graph. Frequencies are reported after background subtraction and medians are indicated below the graph. Representative flow plots are shown in D. The bars in E and F represent the median response. Friedman test with Dunn’s correction for multiple comparisons was used to determine statistical significance. Significance is shown as: ****p<0.0001, ***<0.001, **p<0.01, *p<0.05.

