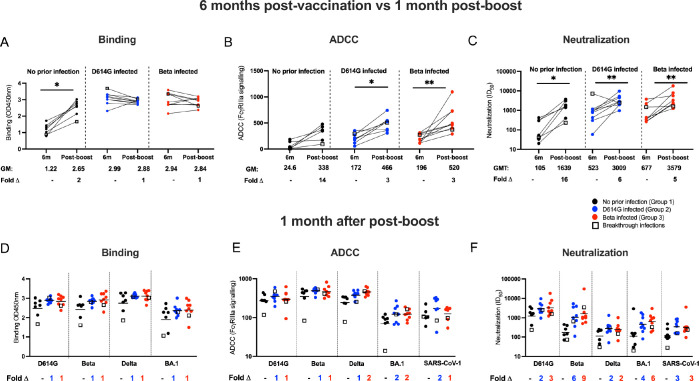
Fig 3. The antibody response after an Ad26.COV2.S booster dose.
Antibody responses were measured pre-boost at 6 months after primary dose vaccination and compared to responses at one month after a homologous boost. Plasma samples from patients with either no prior infection (black), infected with D614G (blue), and infected with Beta (red) were tested for binding (A), antibody-dependent cellular cytotoxicity (ADCC) activity (B) and neutralization (C) to the D614G variant. Geometric mean values are shown below the graphs. Binding antibodies were quantified by OD450nm values, ADCC activity was measured in FcγRIIIa signaling and neutralization was indicated by ID50 values. All experiments were performed in duplicate. The Wilcoxon matched-pairs signed rank test was used to determine statistical significance between the 6 months post-vaccination and one month post-boost time points. Significance is shown as: **p<0.01, *p<0.05. Binding (D), ADCC activity (E) and neutralizing (F) responses between groups were tested one month after the booster dose. Bars in D and E represent geometric mean and bars in F represent geometric mean titer. Plasma activity was tested against the D614G, Beta, Delta and BA.1 variants and SARS-CoV-1. Fold changes are shown below the graphs. All experiments were performed in duplicate. Statistical significance between the different groups was determined using the Kruskal-Wallis test with Dunn’s correction for multiple comparisons. None of the comparisons were statistically significant.

