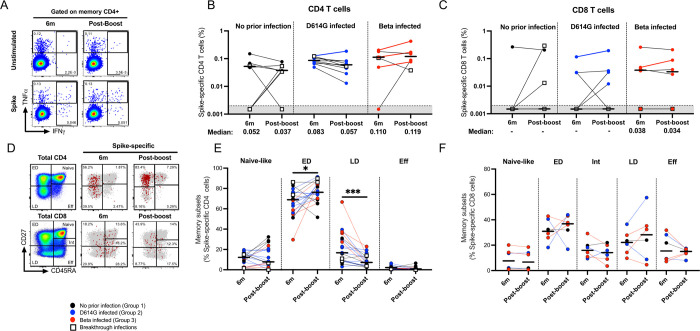
Fig 4. T cell response and phenotyping after an Ad26.COV2.S booster dose.
T cell cytokine responses were measured at 6 months post-vaccination and compared to responses at one month after a homologous boost. PBMCs from patients with either no prior infection (black), infected with D614G (blue), or infected with Beta (red) were tested for frequency of spike-specific CD4+ (A and B) and CD8+ T cells (C) producing any of the studied cytokines (IFN-γ, IL-2 and TNF-α) in response to ancestral peptide pools. Bars represent medians with values indicated below the graphs and the colored lines represent participants with increased cytokine responses. Data are plotted as background subtracted total cytokine responses. Due to high TNF-α background, single TNF-α producing cells were excluded from analysis. Representative plots are shown in A. Representative overlay flow plots of CD27 and CD45RA expression are shown in D. Red dots depict SARS-CoV-2-spike-specific expression at 6 months (middle) and post-boost (right). Grey dots represent total CD4 (upper panel) or CD8 T cells (lower panel). Using CD27 and CD45RA, four memory subsets can be delineated (left panel): naive (CD27+CD45RA+), early differentiated (ED; CD27+CD45RA-), late differentiated (LD; CD27-CD45RA-) and effector (Eff; CD27-CD45RA+) subsets. Summary graphs of the frequency (%) of each subset within SARS-CoV-2-spike-specific CD4 (E) or CD8 T cells (F). Wilcoxon matched-pairs signed rank test was used to determine statistical significance. Significance is shown as: ***<0.001, **p<0.01, *p<0.05.

