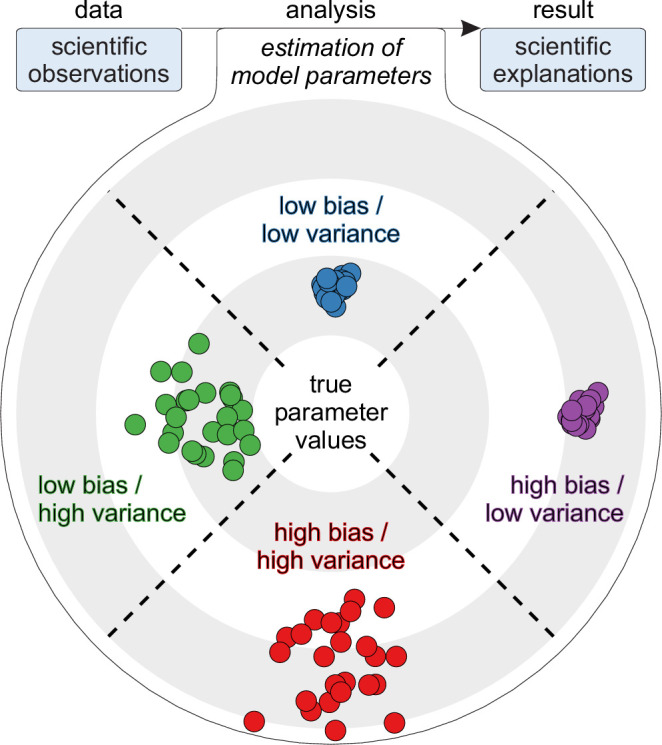
Appendix 1—figure 1. Statistical perspective on trueness and precision.

Top (flowchart): Analyses as parameter estimates of explanatory models. Bottom (target): Four example parameter estimates with distinct precision and trueness profiles (colored dots). True parameter values denote true explanations and not true predictions. High-bias estimates denote explanations that have low relative trueness. By contrast, high-variance estimates denote explanations that have low precision.
