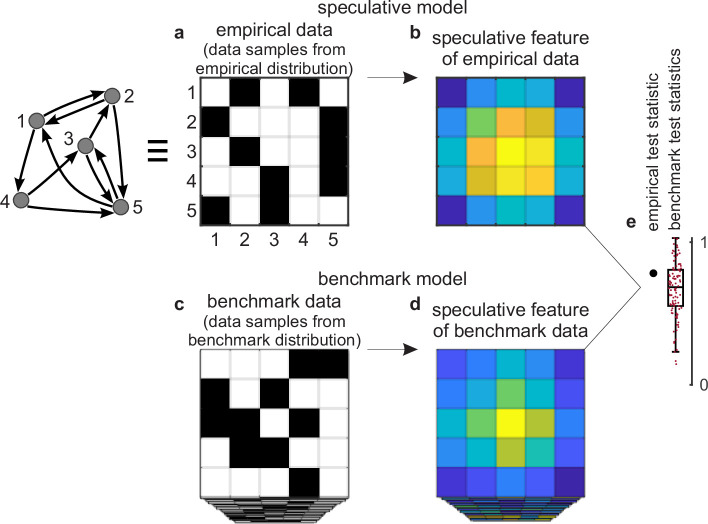
Figure 2. Tests against benchmark models.
(a) An empirical data sample. The diagram (left) shows a network representation of this sample. This example shows only one empirical data sample, but in general there could be many such samples. (b) A speculative feature computed on empirical data. In this example, the feature has the same size as the data, but in general it could have an arbitrary size. Colors denote values of feature elements. (c–d) Corresponding (c) benchmark data samples and (d) speculative features computed on these data. (e) Empirical test statistic (large black dot) and corresponding benchmark test statistics (small red dots). The effect size reflects the deviation of the empirical test statistic from the benchmark test statistic. The uncertainty (confidence) interval and p-value reflect the statistical significance of this deviation. This panel shows a non-significant effect and thus implies that the speculative feature does not transcend the benchmark model of existing knowledge.

